The icon with the unit name is displayed when the graph has at least two parameters
with the same unit. Select this icon to rescale waveforms having the same unit to a
common scale (described by one of the common parameters). Remember that when
scales are not unified, only one waveform with unit assigned to the axis is scaled to
the indicated scale and its plot is adjusted to the size of the window - other wave-
forms, even having the same unit, are not scaled.
returning to the Selecting data for the plot menu
performing the screenshot
The diagram can be scaled with gestures. To zoom in, move apart the two fingers
touching the screen in the opposite directions). To zoom out – bring together the
two fingers touching the screen).
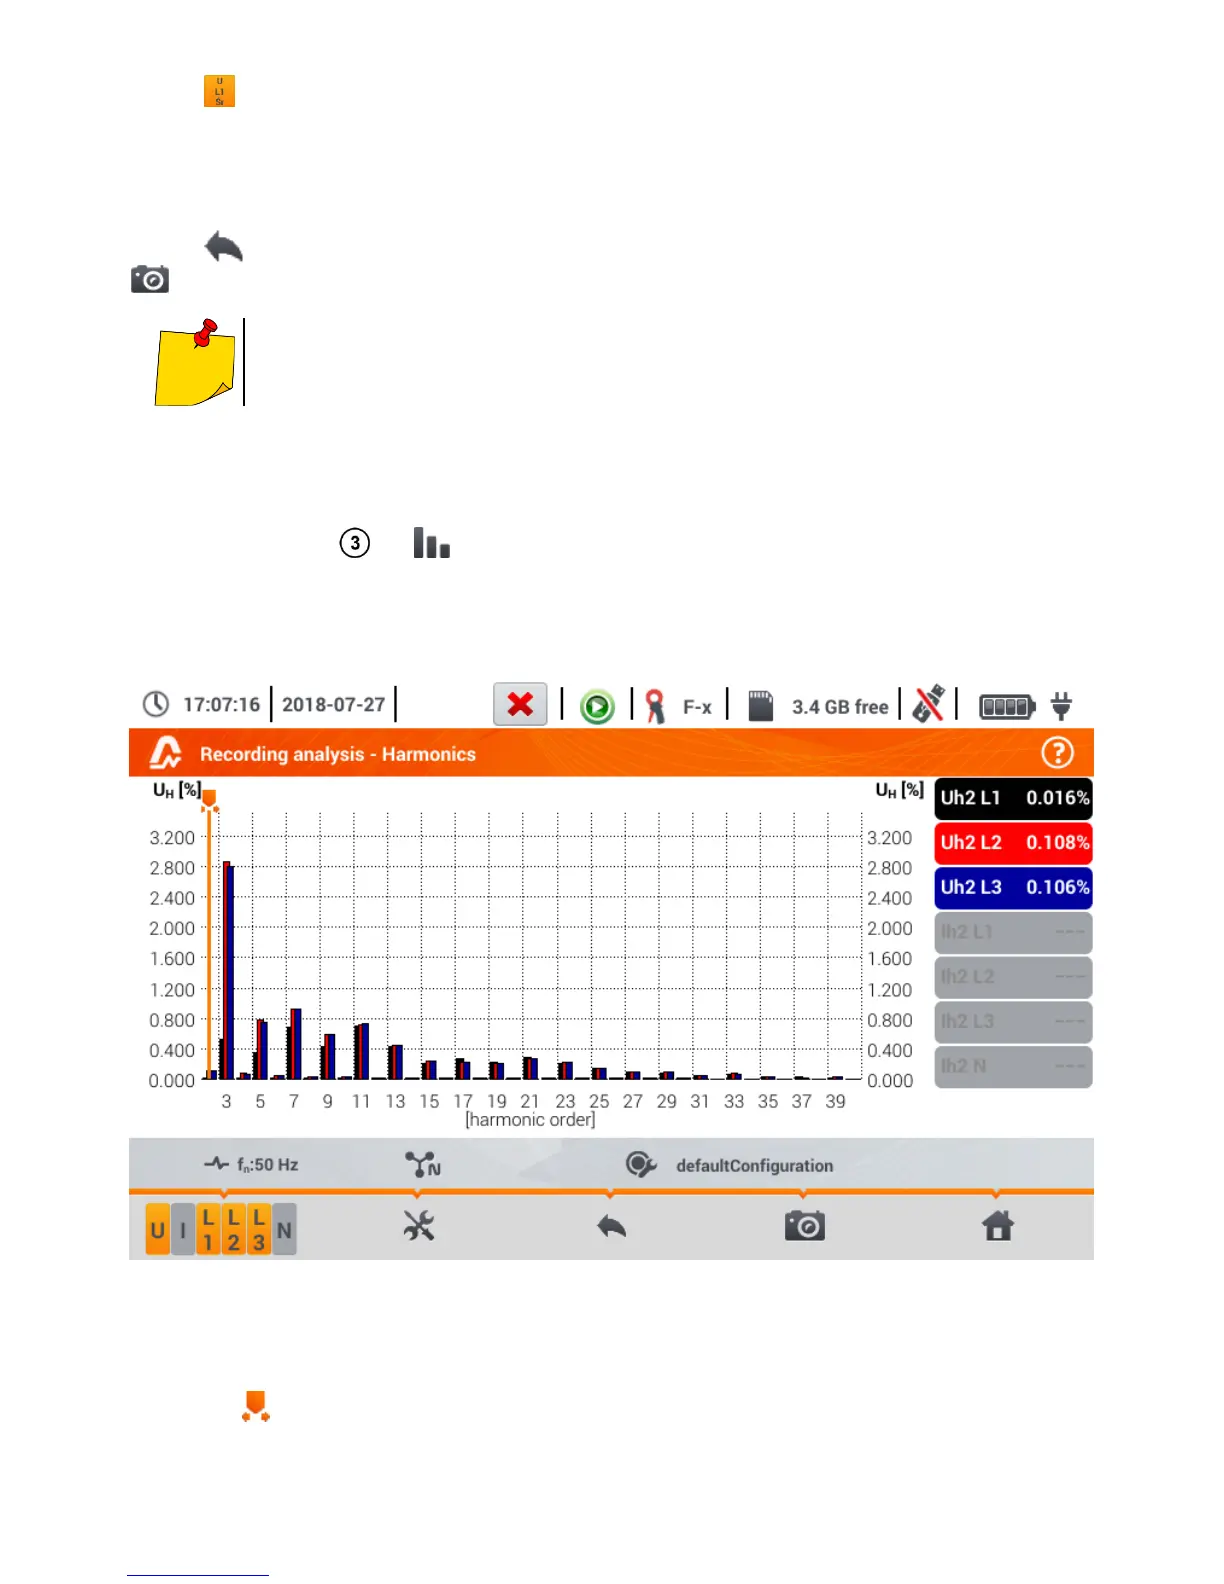
4.8.2 Harmonics waveform graph
If in section 4.8 step the icon has been selected, the screen shown in Fig. 4.23 will appear.
The workspace consists of a graph, the labels menu and function icons menu.
This screen allows you to view the harmonics of voltages and currents, angles between the current
and voltage harmonics, cosφ factors of these currents and THD factors. Harmonics are displayed
graphically in a bar graph (default) or in a table.
Fig. 4.23. Live mode - harmonics - bar graph
The graph includes:
o graphs for the harmonics selected from the menu Graph data selection,
o slider - indicator of actual values. The user can slide it to any graph point.