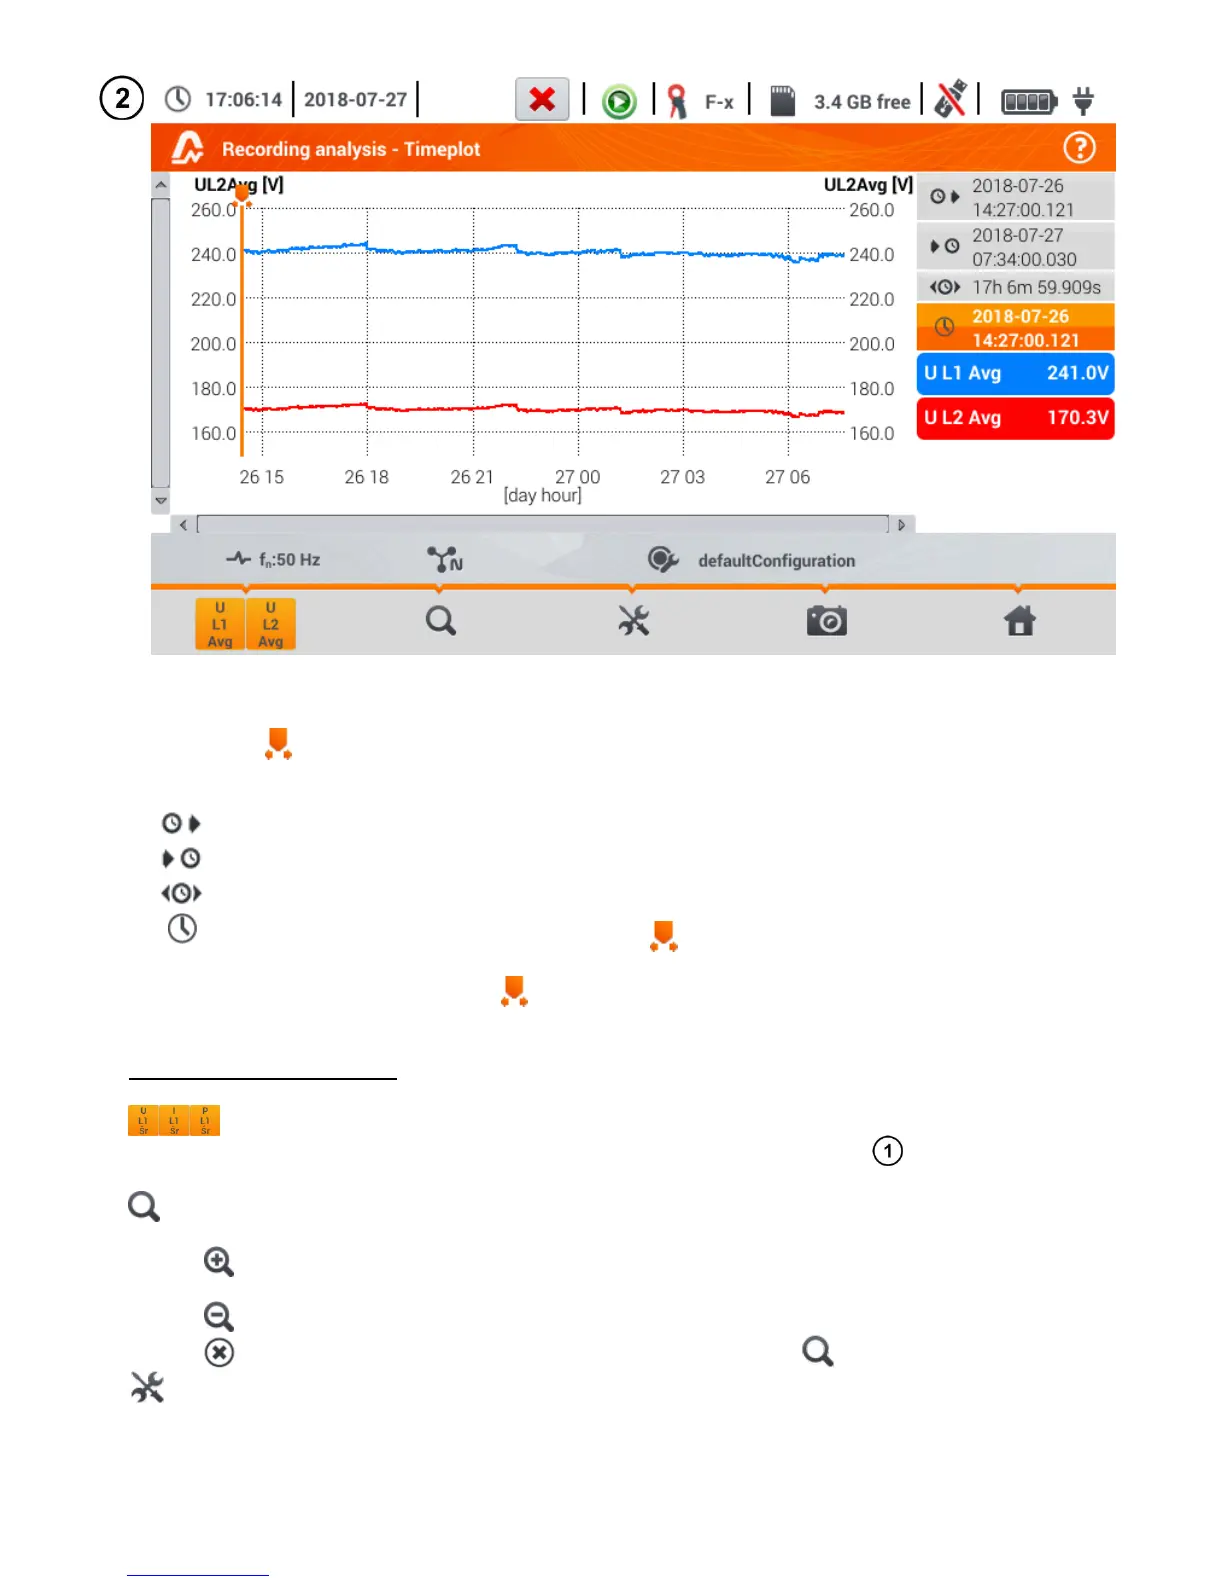
The timeplot appears. It includes:
o waveforms for the values selected in the menu Selecting data for the plot,
o slider - indicator of actual values. The user can slide it to any graph point.
On the right side of the screen you can see:
time of starting the recording process,
time of stopping the recording process,
duration of the recording process.
time corresponding to the position of the slider ,
o labels for individual waveforms. They display instantaneous values of the readings, correspond-
ing to the position of the slider on the plot. In addition, tapping the label hides the graph that
it represents.
Description of function icons
menu of active channels. After this icon has been selected, an additional menu bar opens
with buttons to enable and disable the display of waveforms set for step . The active channel
is indicated by orange colour of the button.
zooming of the displayed waveform. After the icon has been selected, a menu expands with the
following options:
after selecting this icon, use you finger to circle the area which is to be zoomed in.
The graph is then enlarged; it may be moved with a finger up, down and to the sides
after selecting this icon graph will be zoomed out in steps
selecting this icon closes the zooming menu (also, the may be selected)
options menu for a chart or table. After the selection has been made, an additional menu bar
appears which enables selection of a scale description on the right side and on the left side of
the graph. To do this, click on the icon with the name of the parameter.