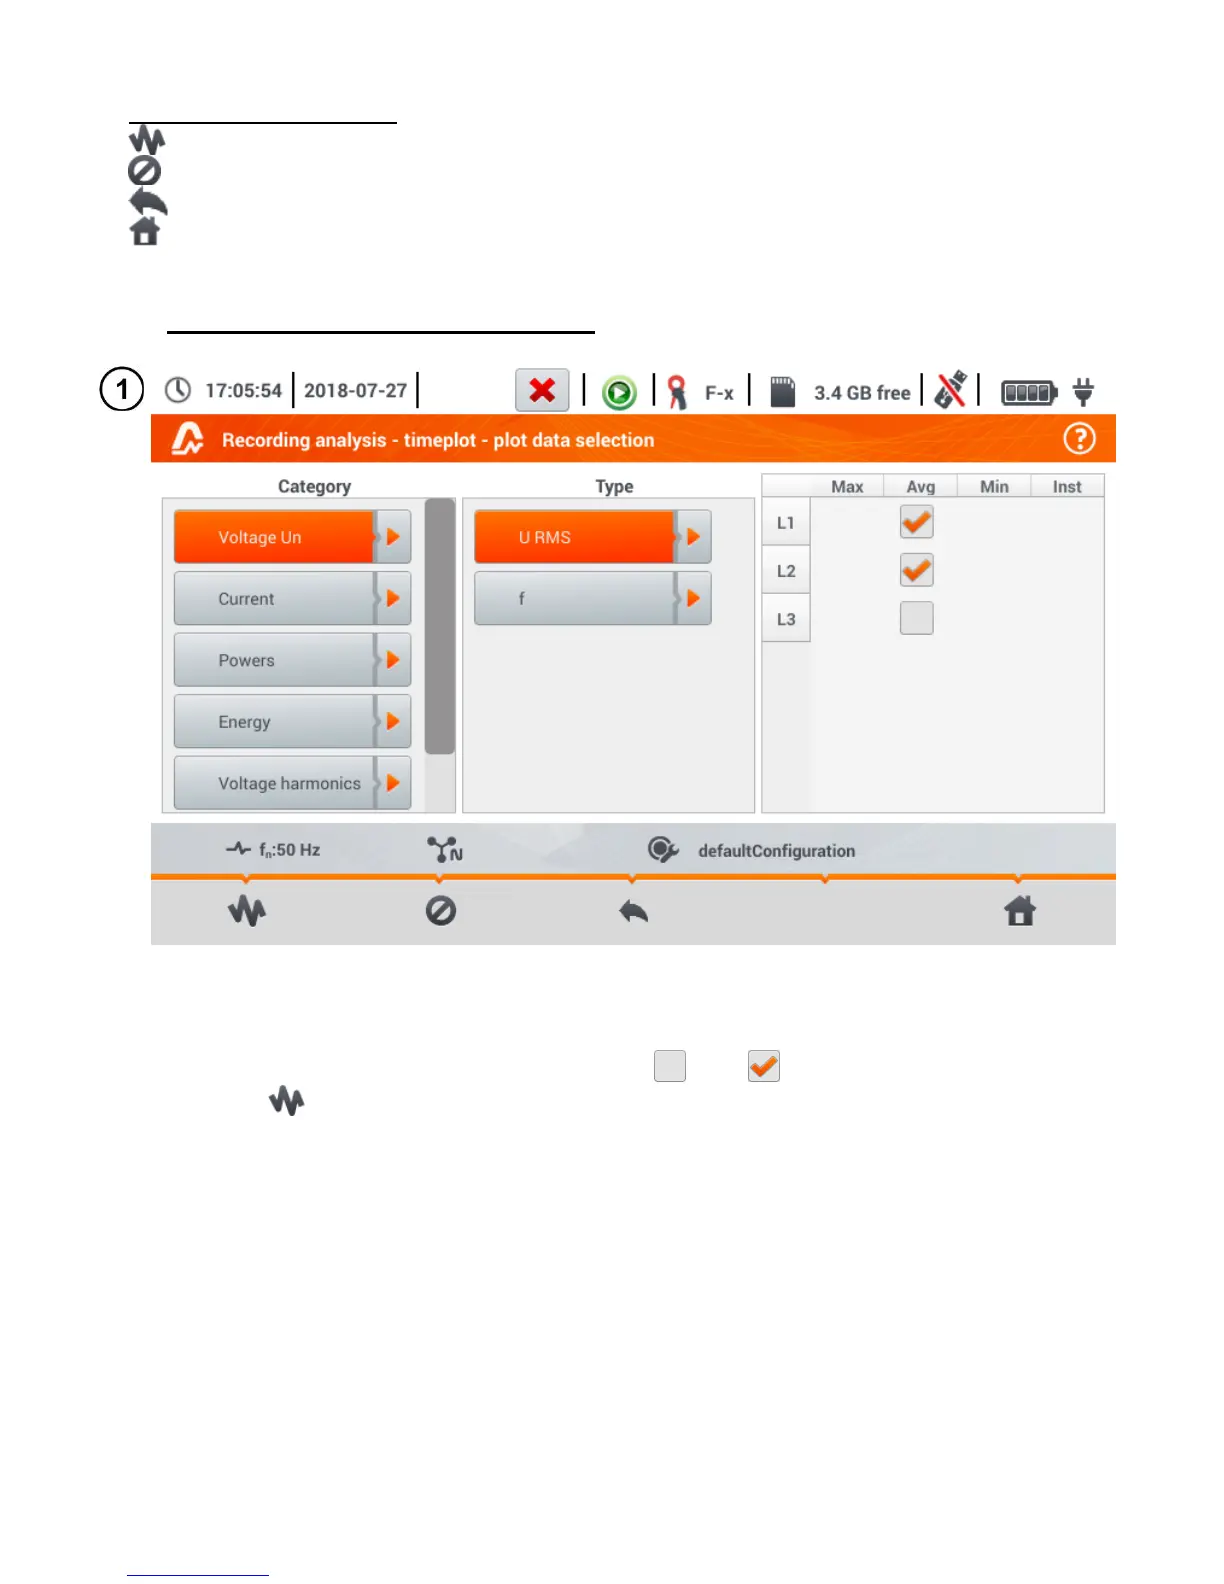
Description of function icons
calling up the time graph
deselecting all variables
returning to menu Timeplot – time interval (pointa)
return to the main menu of the recorder mode
c. Creating and managing a timeplot
Select the data to be displayed on the plot on the Selecting data for the plot screen. For this pur-
pose:
in the Category column select the required item, in the Type column select the required parameter,
and in the last column select the required variable ( ),
select the icon.