4.8.1 Recording timeplot
a. Functional Description
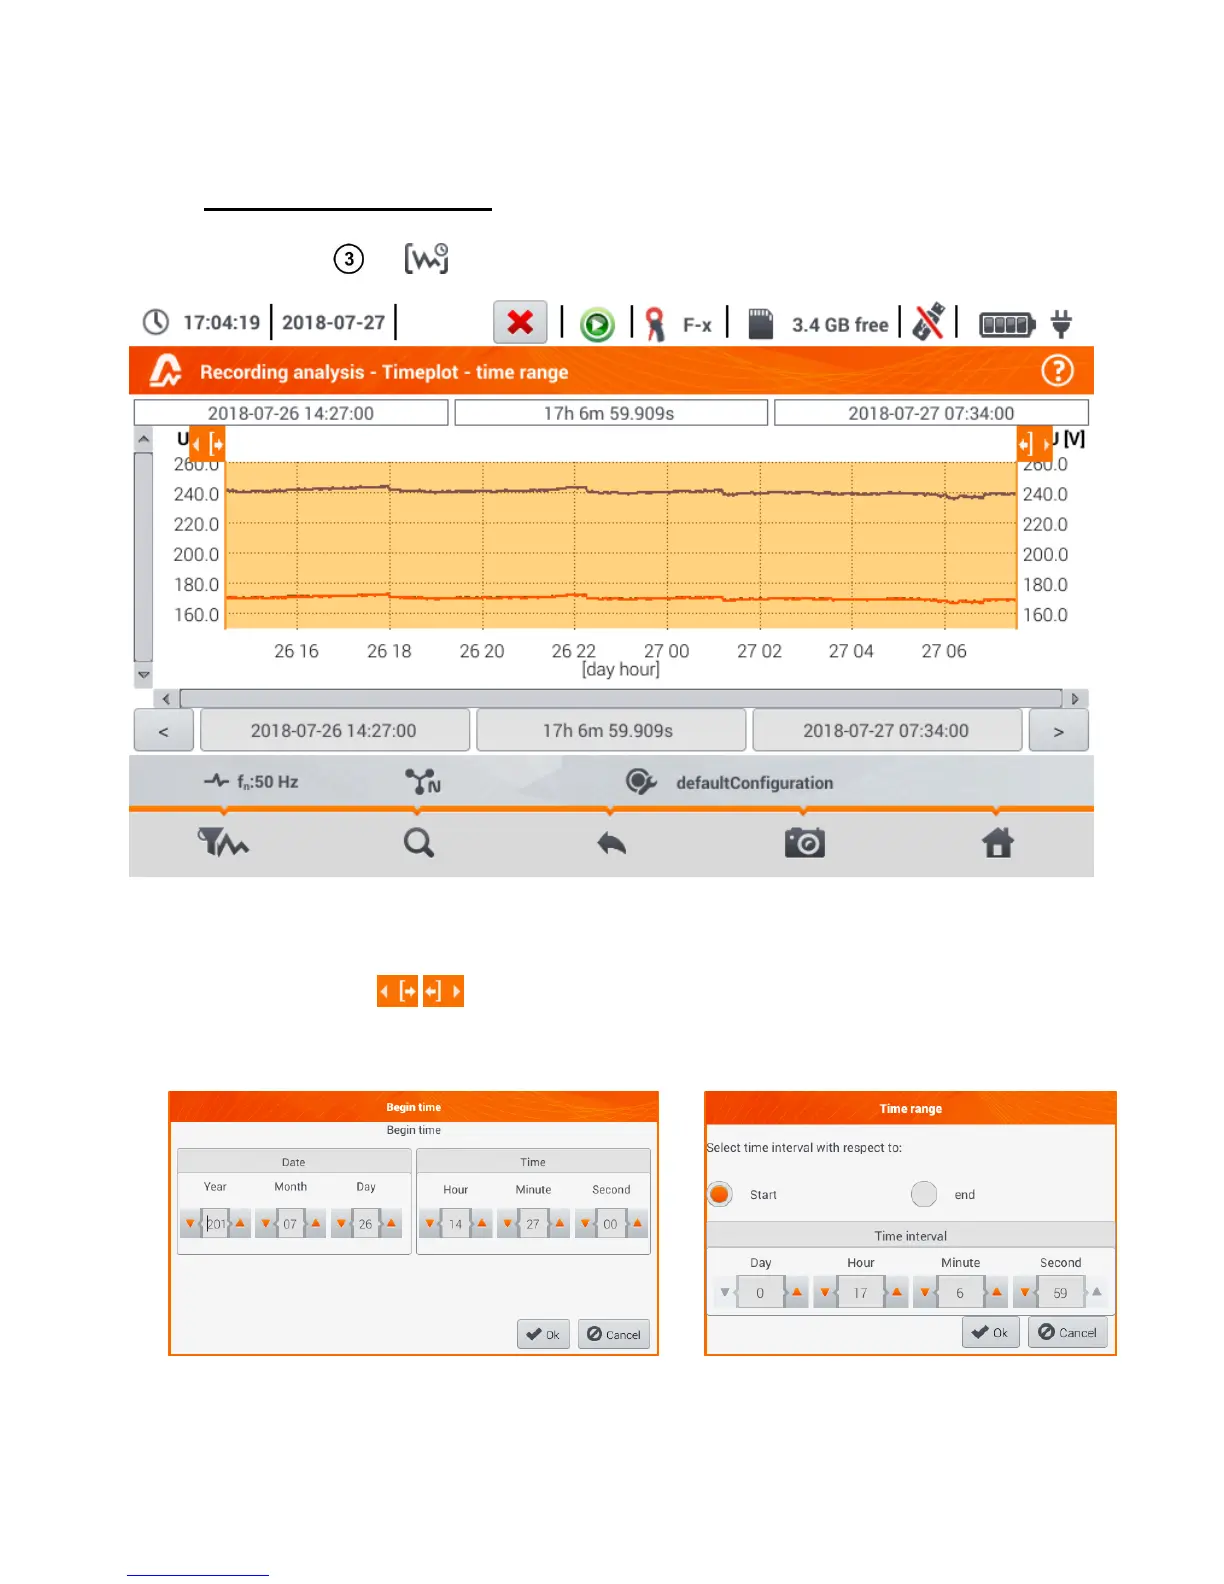
If in section 4.8 step the icon has been selected, the screen shown in Fig. 4.19 will appear.
Fig. 4.19. Recording timeplot
The range of data to be analysed may be determined in two ways:
by dragging the icons above the graph or
by manually entering boundary values of date and time and the interval for analysis.