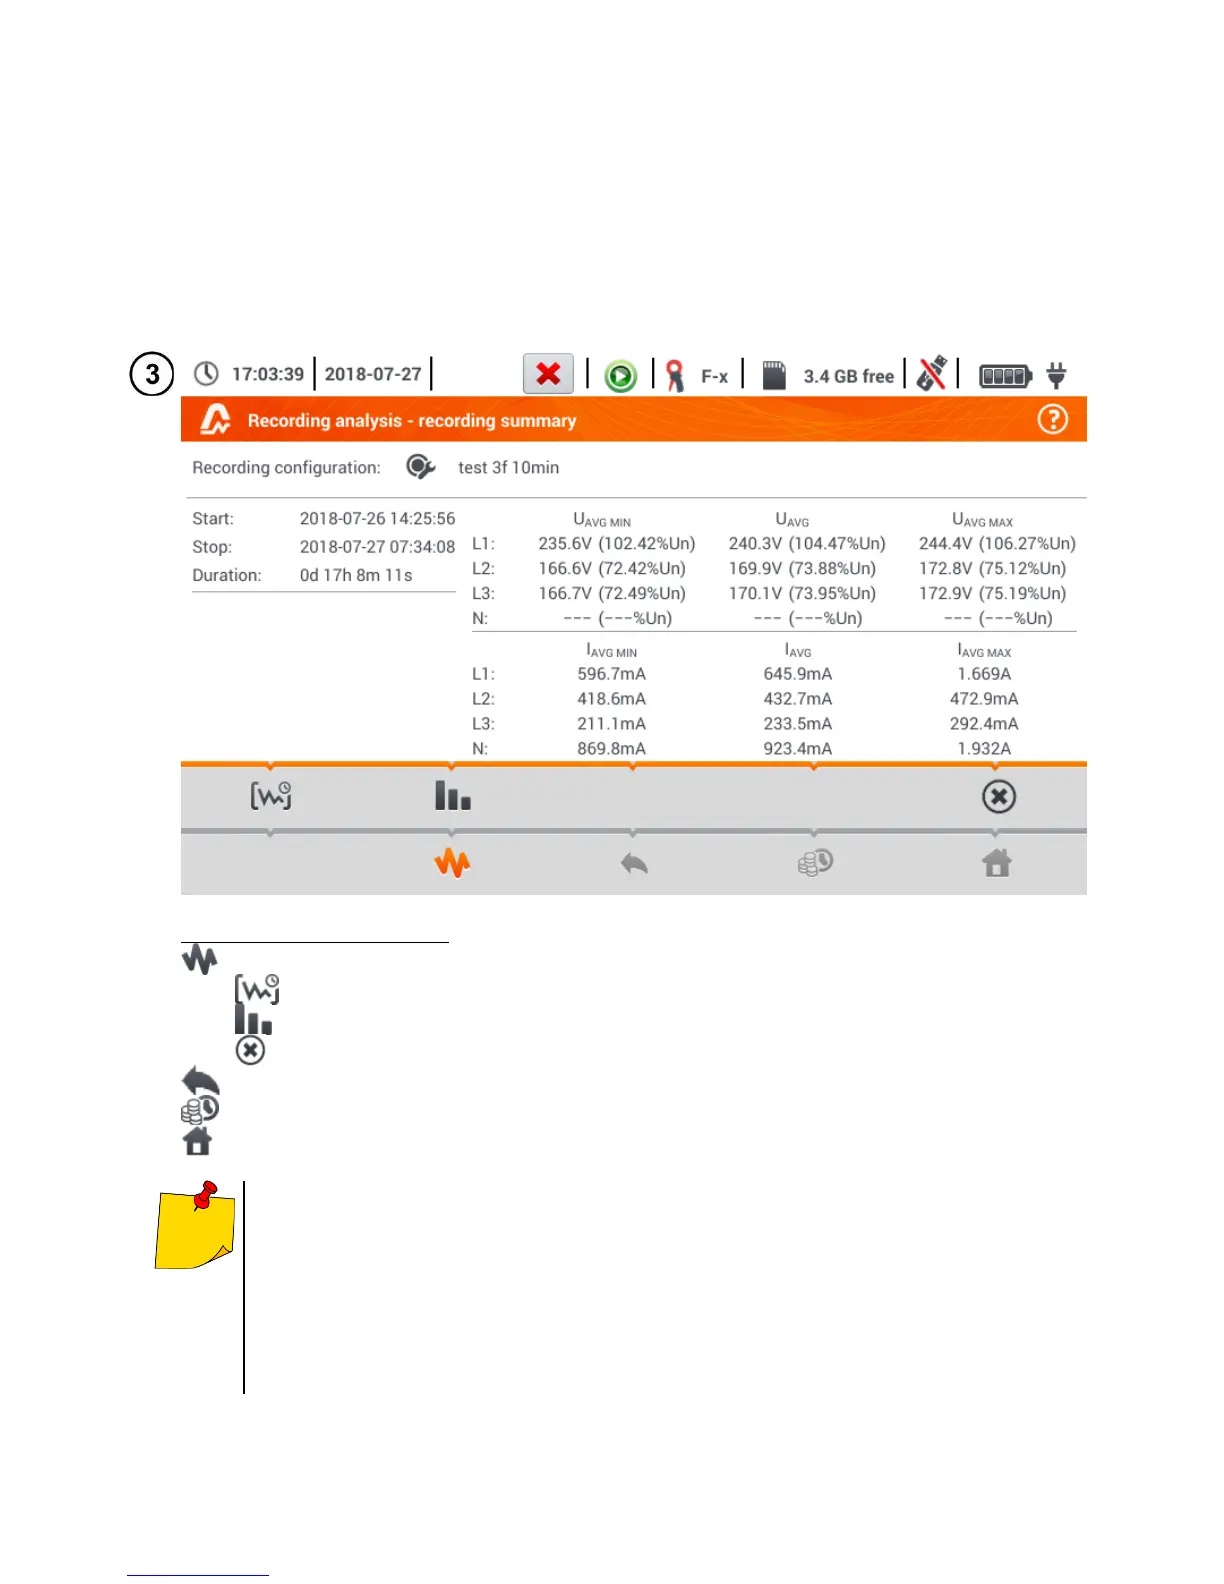
In addition, the parameters of voltage and current in the phase conductor and the neutral con-
ductor are shown:
U
ŚR MIN
minimum average voltage; the percentage relative to rated voltage Un is shown in
brackets,
U
ŚR
average voltage; the percentage relative to rated voltage Un is shown in brackets,
U
ŚR MAX
maximum average voltage; the percentage relative to rated voltage Un is shown in
brackets,
I
ŚR MIN
minimum average current,
I
ŚR
average current,
I
ŚR MAX
maximum average current.
Description of function icons
expanding graphical analysis options:
recording timeplot (section 4.8.1)
harmonics waveform graph (section 4.8.2)
closing the menu
return to the file manager
energy costs calculator (section 4.8.3)
return to the main menu of the recorder mode
Minimum and maximum voltage values are determined from the recorded aver-
age values (these are not minimum and maximum RMS
1/2
values ). In addition to
the values in volts, in brackets you can see the percentage value related to the
nominal voltage. If a channel has not been measured in a given configuration,
dashes are displayed.
Minimums and maximums of currents are determined from the average cur-
rents. If a channel has not been measured in a given configuration, dashes are dis-
played.