Technical data are subject to change without notice.
© Copyright SPM 2002-04. 71650.B
SPM Instrument AB • Box 504 • S-645 25 Strängnäs • Sweden
Tel +46 152 225 00 • Fax +46 152 15075 • info@spminstrument.se • www.spminstrument.se
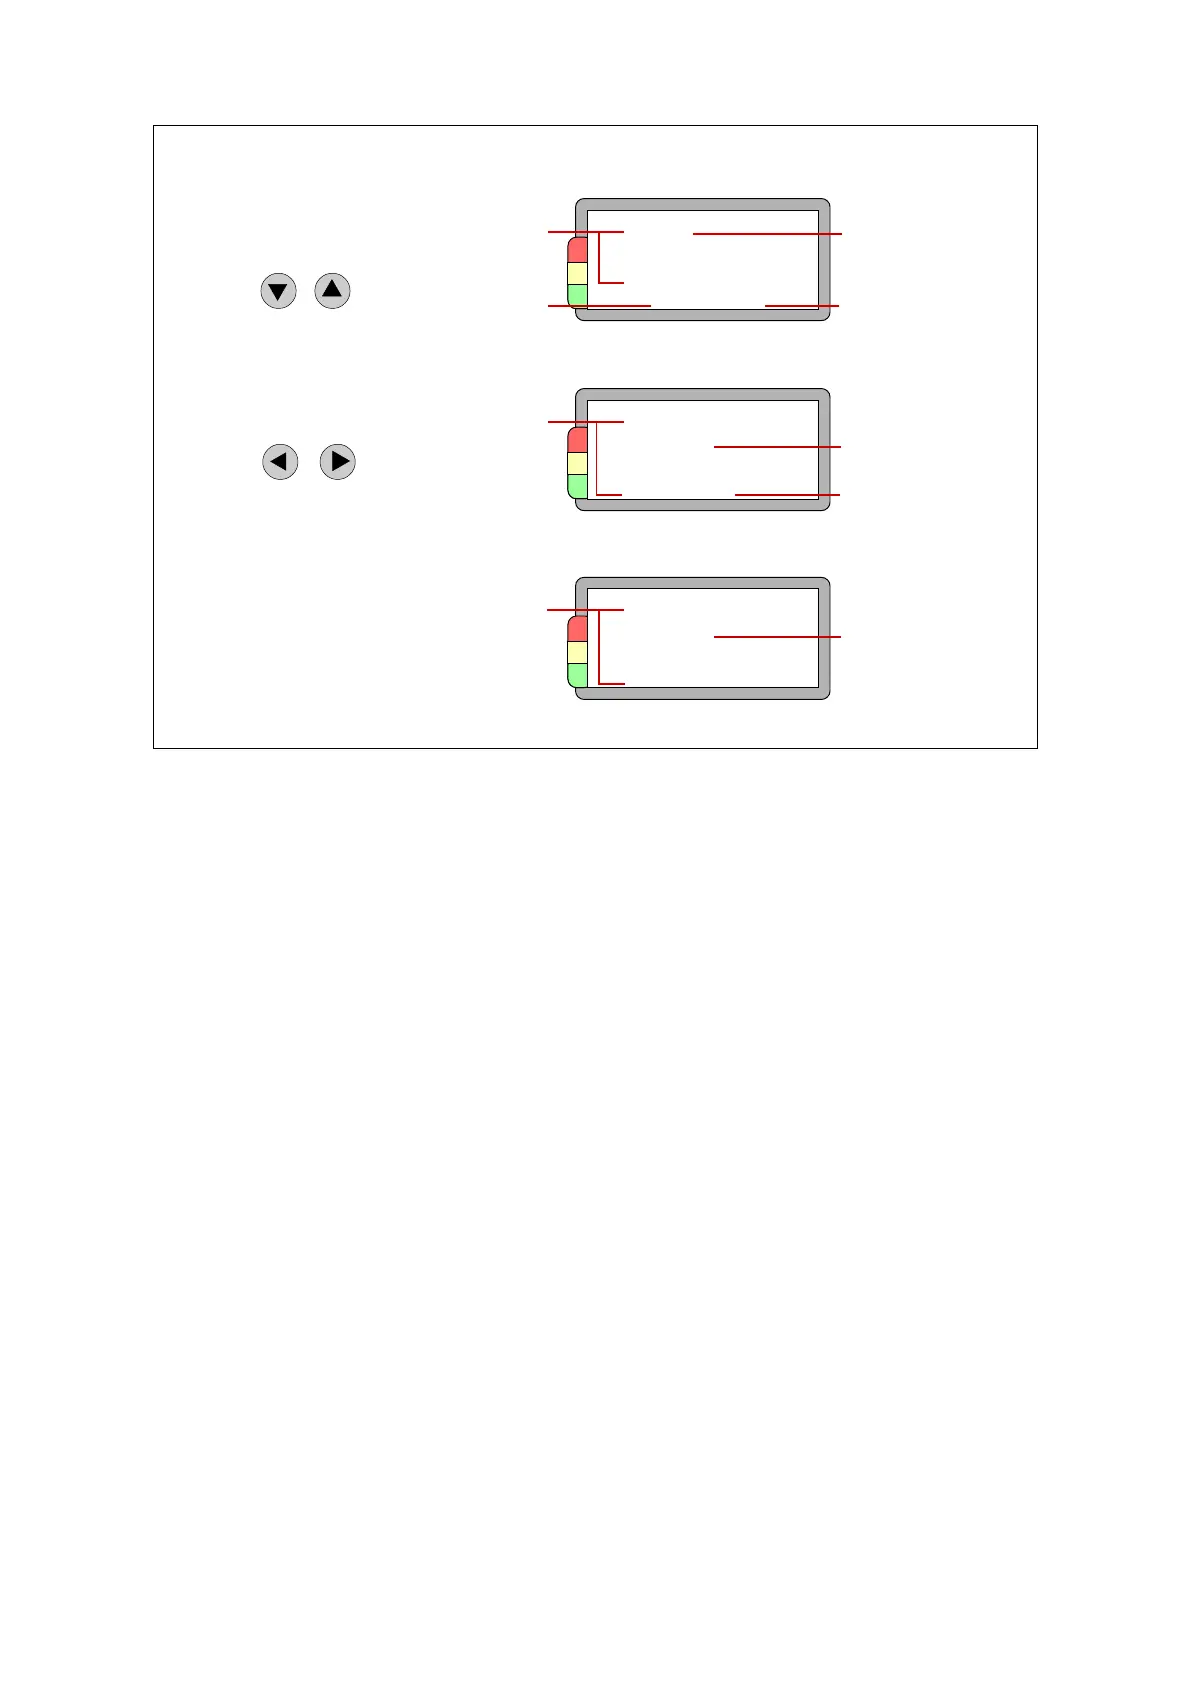
Displays in data logging mode [Logger, Expert]
The figure shows the various displays while measuring with a data logger. The example shows an
SPM measurement, but the principle is the same for all techniques. For details, see the descriptions
for manual measuring mode.
When you scroll through the round, you use UP/DOWN to go to the next measuring round, RIGHT/
LEFT to go to techniques under each measuring point.
A note on vibration measurement:
For VIB measuring points, you can set up one to three measuring directions and save a result for
each. Moreover, for each measuring direction you can measure a spectrum and save up to 200
lines. With the spectrum measurement, you also save the EVAM condition parameters VEL, ACC,
CREST, KURT, and SKEW. These are not displayed by the instrument.
Measuring
point number
Number in
the round
Measuring
point name
Measuring
technique
1 Measuring point data
AT30.200.04
Exhaust fan 6
fan N
SPM 014
3 New result
Previous
date
Basic
data
Previous
result
2 Previous result
AT30.200.04
TLT 21 971124
dBm 17
dBc 8 dB i 10
Number of
the reading
New
result
AT30.200.04
TLT 20 MEAS 2:3
dBm 15
dBc 8 dB i 10
Displays while
data logging
Go to
next point
Go to
next technique
56 Data logging