Instruction Manual
for
AS380 Series Elevator Integrated Drive Controller
201
No. Name
Recommended values
and reference range
Parameter range
F0
Acceleration
slope a1
0.500
(0.400~0.650)
The smaller this value is, the more stable the acceleration
is. But too small will be inefficient. The greater this value
is, the more sudden the acceleration is: ① if too sudden,
users do feel uncomfortable; ② too sudden can lead to
over-current fault. General 0.400 for 1m / s, 0.500 for 1.5 ~
1.8m / s and 0.600 for 2.0m / s are appropriate. Especially
it should not be great for elevators in hotels or the
residential elevators with many children and old people.
F1
Deceleration
slope a2
0.500
(0.400~0.650)
The smaller this value is, the more stable the acceleration
is. But too small will be inefficient. The greater this value
is, the more sudden the acceleration is: ① if too sudden,
users do feel uncomfortable; ② too sudden can lead to
over-current fault. General 0.400 for 1m / s, 0.500 for 1.5 ~
1.8m / s and 0.600 for 2.0m / s are appropriate. Especially
it should not be great for elevators in hotels or the
residential elevators with many children and old people.
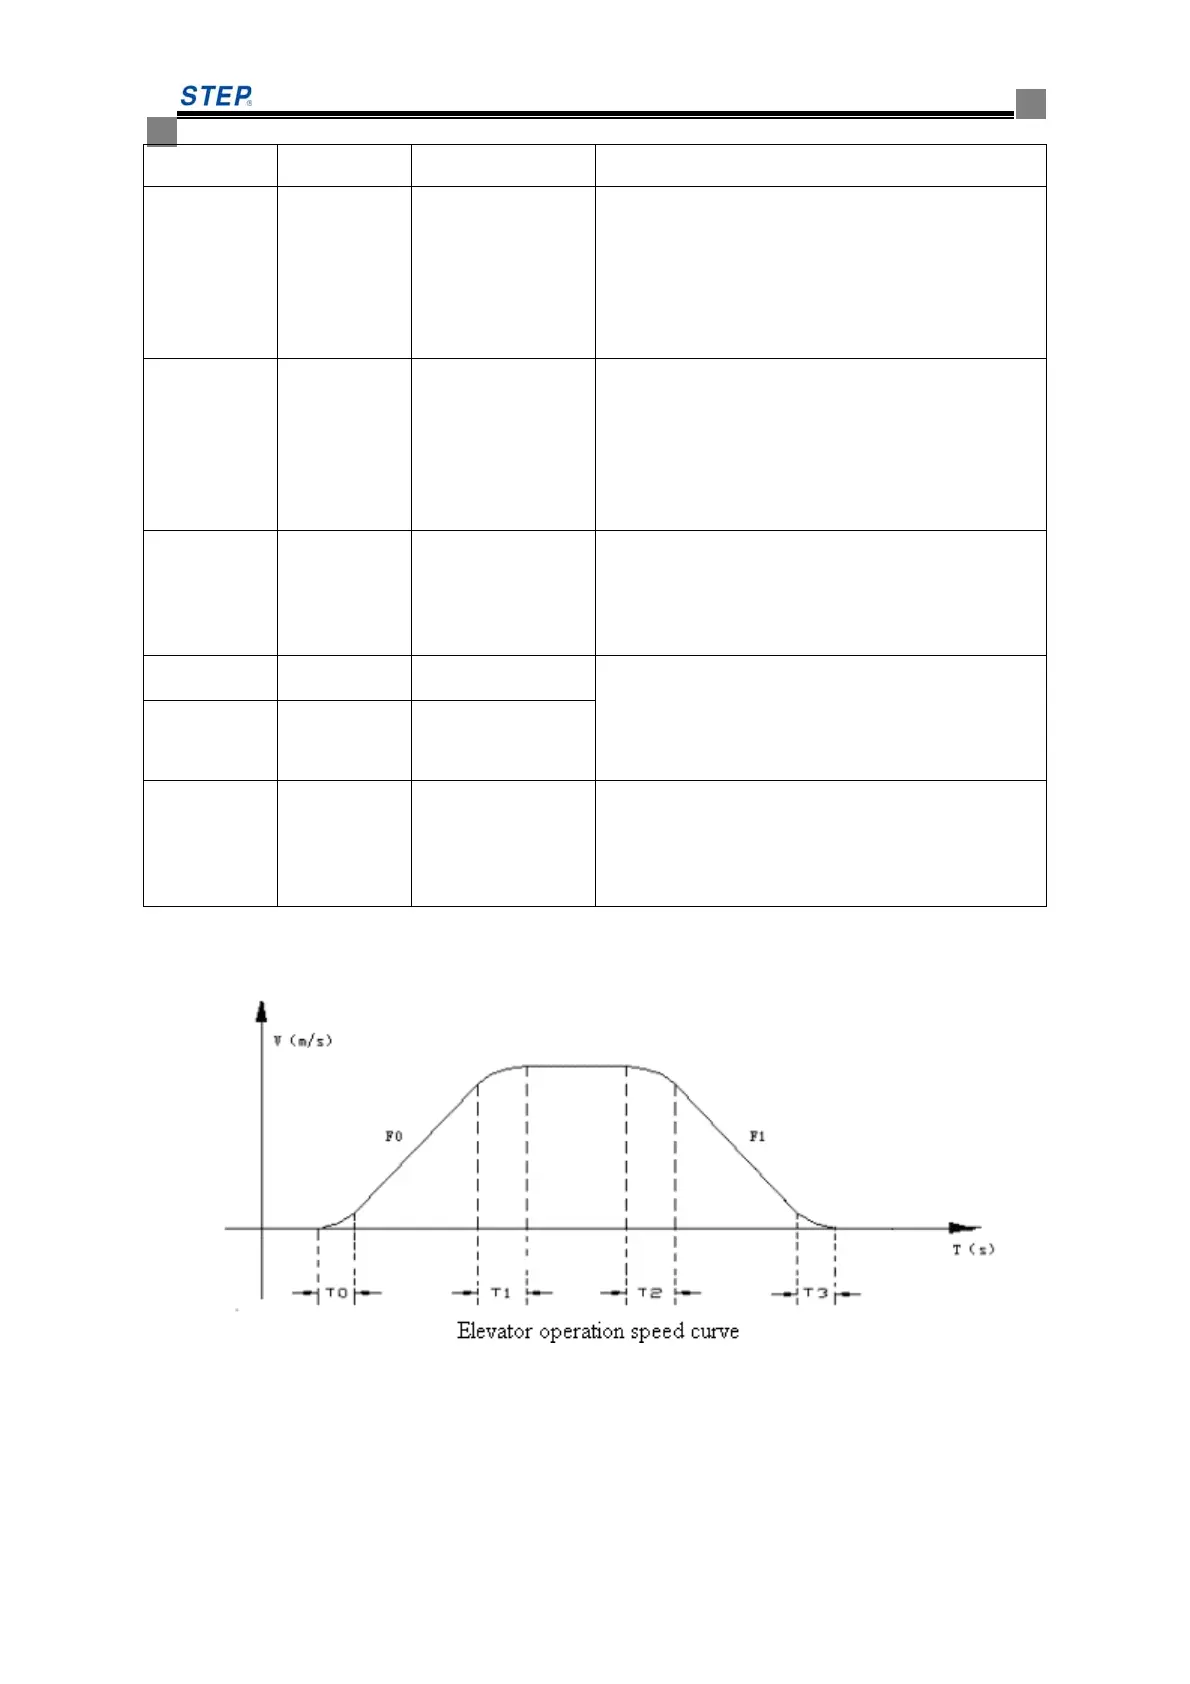
F2 S Curve T0
1.300
(1.300~1.600)
T0: transition time curve from start-up to acceleration
beginning, the greater the value is, the more stable the
start-up is. In this time, the elevator runs at very low speed.
But too long may lead to failure of motor to drag the
elevator and cause "PGO" fault, or over-current fault,
especially when lift car is fully or heavily loaded.
F3 S Curve T1
1.100
(1.00~1.200)
T1 is the transition time curve between acceleration end to
the highest speed, T2 is the transition time curve between
the highest speed deceleration beginning.
T1 and T2 have no significant effect on comfort, generally
not adjusted. If T2 adjusted too much, may lead to level
rush.
F4 S Curve T2
1.100
(1.000~1.200)
F5 S Curve T3
1.300
(1.300~1.600)
T3is the transition time curve between deceleration end
tostop, the greater the value is, the more stable the stop is.
In this time, the elevator runs at very low speed. But too
long may lead to failure of motor to drag the elevator and
cause "PGO" fault, or over-current fault, especially when
lift car is fully or heavily loaded.
Note: Properly reducing F0 and F1 will increase the comfort of the elevator, but also
decrease the operational efficiency. Properly increasing the time of the four corners F2 ~ F5 can
improve the comfort, but also decrease the operational efficiency.
Figure 8.4 Elevator Operation Curve
4) Adjust Comfort at Stop
The following two points affect the elevator comfort most at stop: 1. the PID value in
low-speed section. According to the previous section, adjusting the PID value in low-speed section
may help the elevator gain the best comfort at stop. 2. Timing for stop. It is mainly the
 Loading...