S'-
Displaying X-Y
Patterns
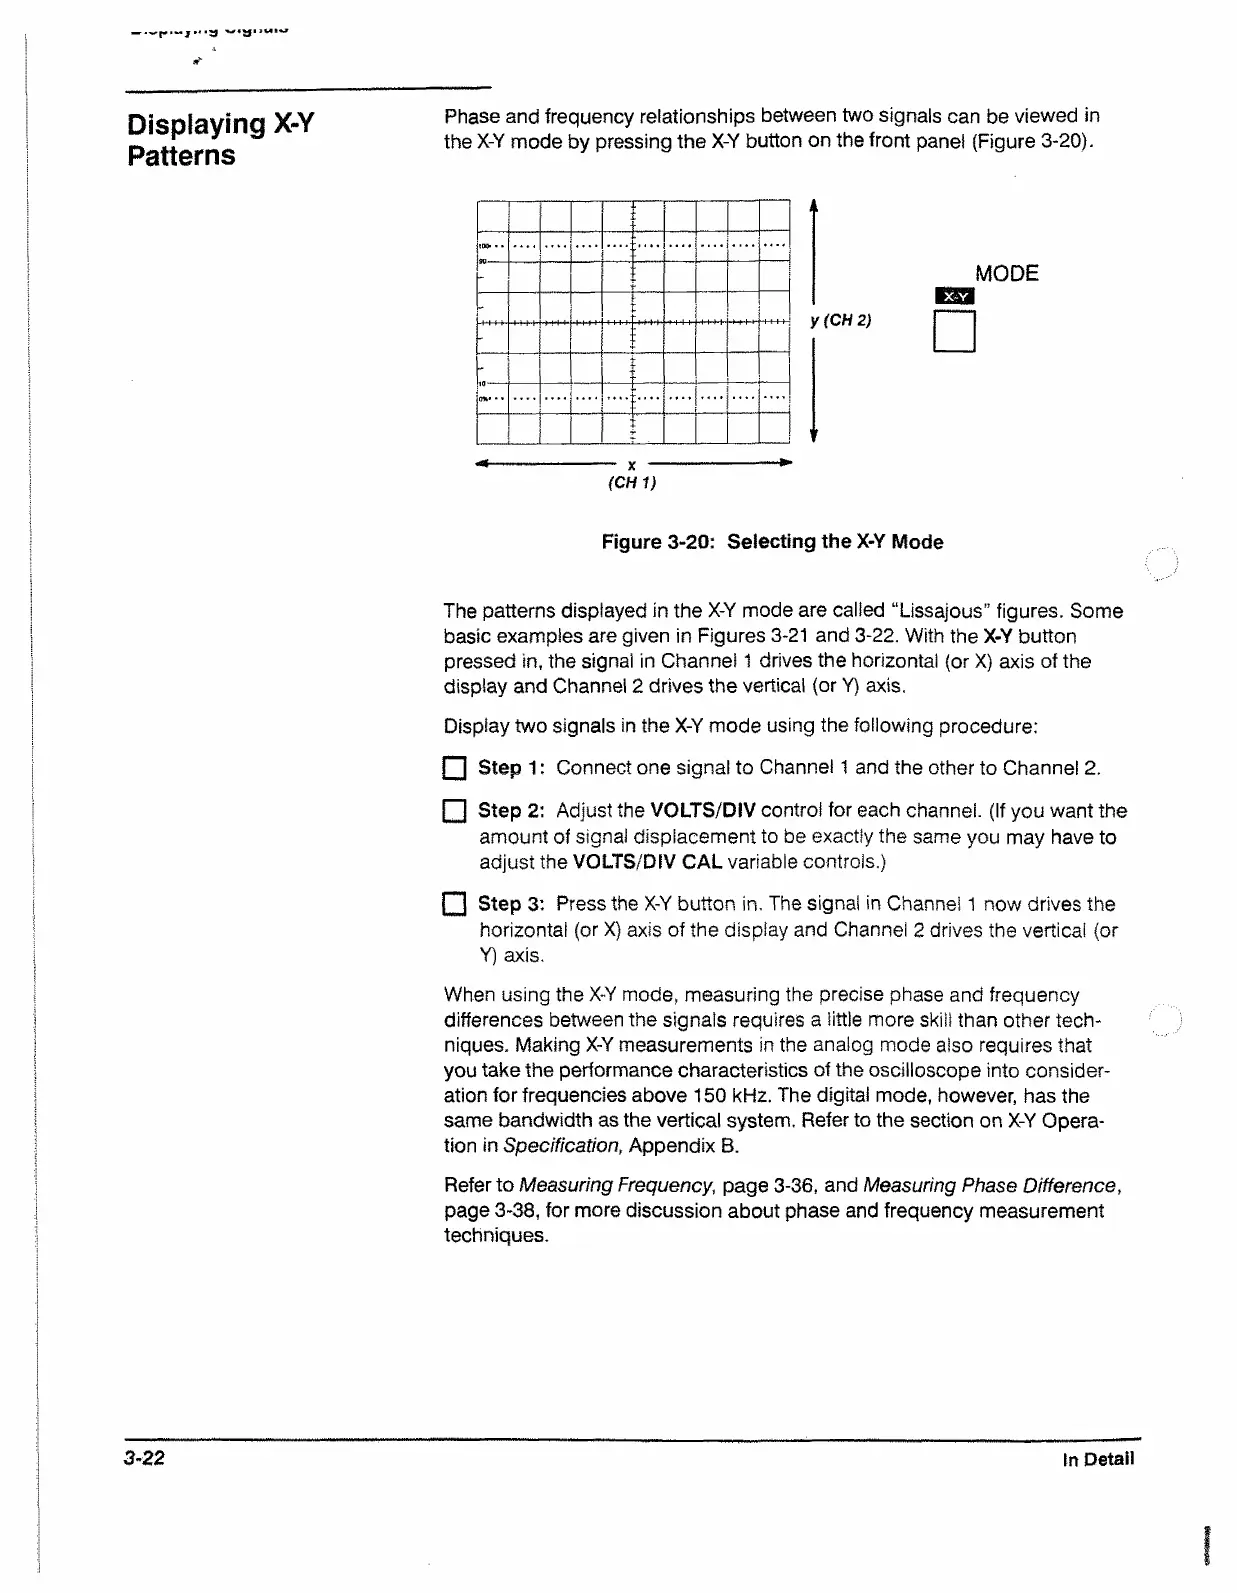
Phase and frequency relationships between two signals can be viewed in
the X-Y mode by pressing the X-Y button on the front panel (Figure 3-20).
I MI.IIII1W..I**-— I — ■■■!■» ■
.
...
(CHI)
k
y (CH 2)
MODE
Figure 3-20: Selecting the X-Y Mode
The patterns displayed in the X-Y mode are called “Lissajous” figures. Some
basic examples are given in Figures 3-21 and 3-22. With the X-Y button
pressed in, the signal in Channel 1 drives the horizontal (or X) axis of the
display and Channel 2 drives the vertical (or Y) axis.
Display two signals in the X-Y mode using the following procedure:
□ Step 1 : Connect one signal to Channel 1 and the other to Channel 2.
□ SteP 2: Adjust the VOLTS/DIV control for each channel. (If you want the
amount of signal displacement to be exactly the same you may have to
adjust the VOLTS/DIV CAL variable controls.)
□ Step 3: Press the X-Y button in. The signal in Channel 1 now drives the
horizontal (or X) axis of the display and Channel 2 drives the vertical (or
Y) axis.
When using the X-Y mode, measuring the precise phase and frequency
differences between the signals requires a little more skill than other tech
niques. Making X-Y measurements in the analog mode also requires that
you take the performance characteristics of the oscilloscope into consider
ation for frequencies above 150 kHz. The digital mode, however, has the
same bandwidth as the vertical system. Refer to the section on X-Y Opera
tion in Specification, Appendix B.
Refer to Measuring Frequency, page 3-36, and Measuring Phase Difference,
page 3-38, for more discussion about phase and frequency measurement
techniques.
3-22 In Detail
 Loading...