Displaying Signals
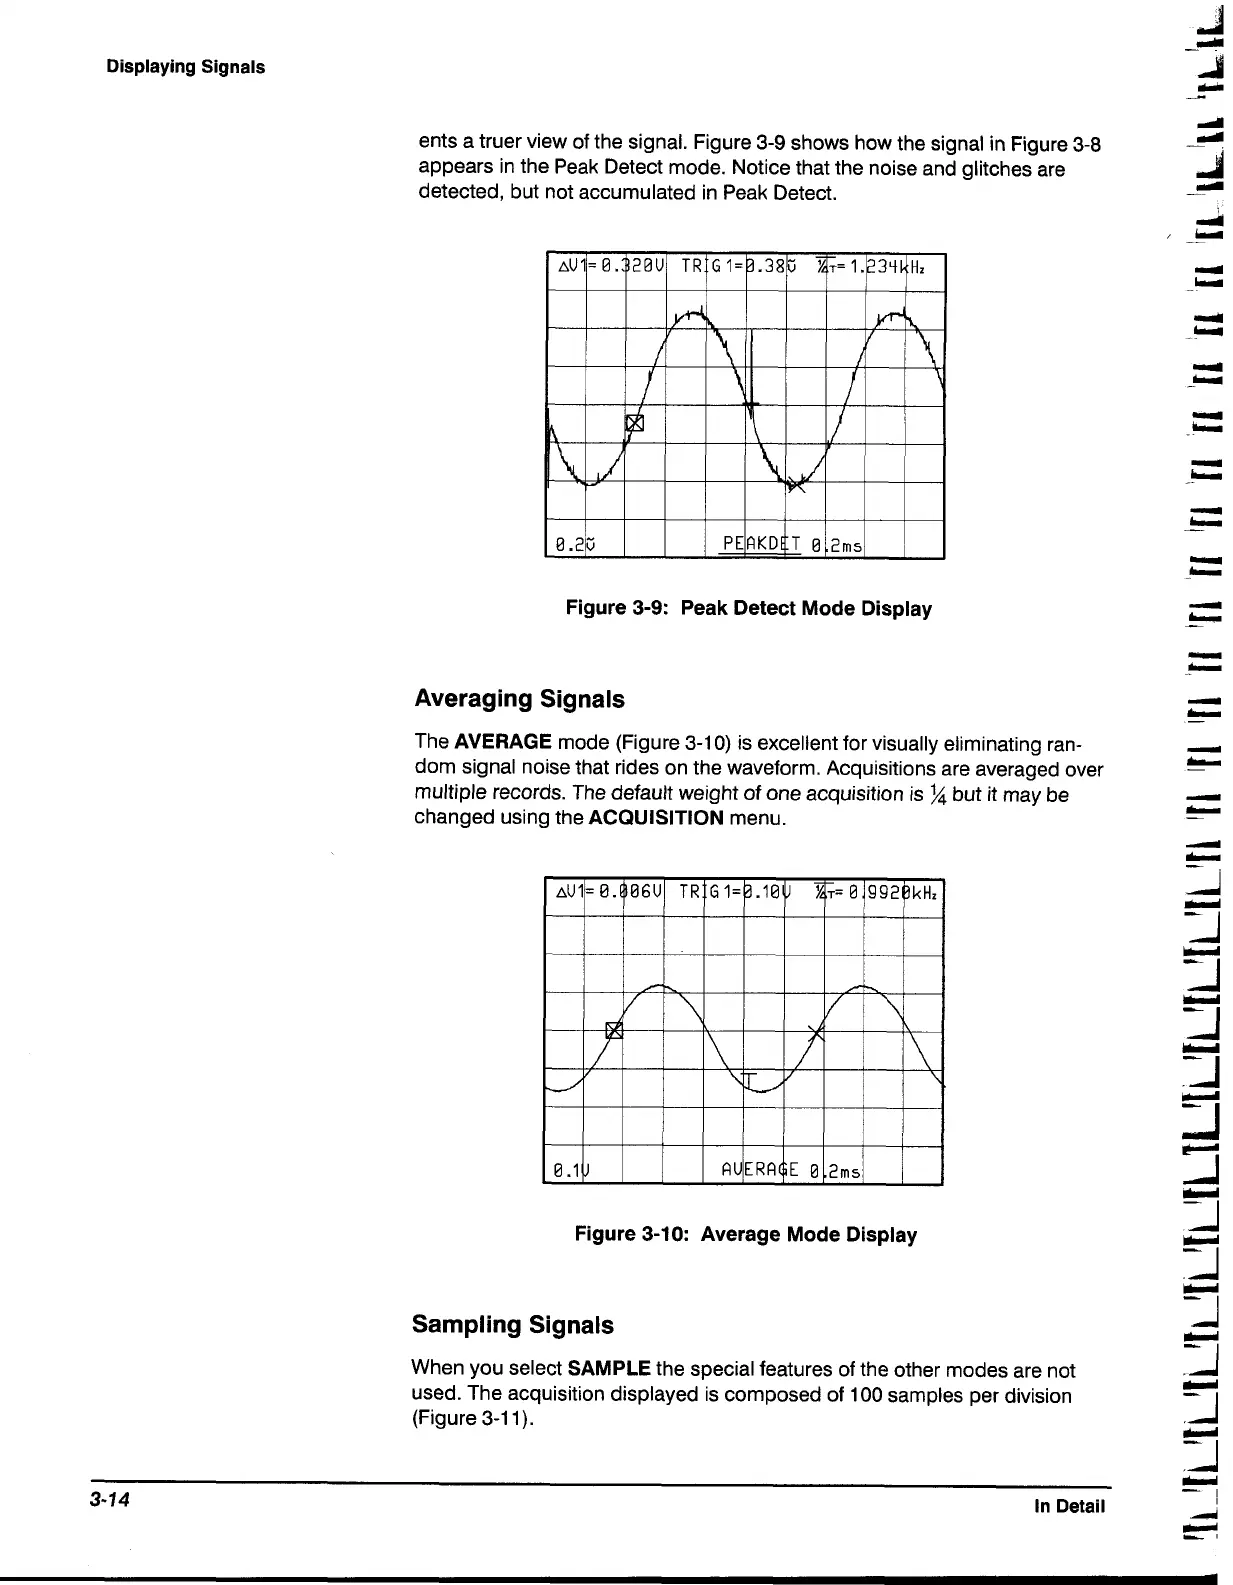
ents a truer view of the signal. Figure
3-9
shows how the signal in Figure
3-8
appears in the Peak Detect mode. Notice that the noise and glitches are
detected, but not accumulated in Peak Detect.
Figure 3-9: Peak Detect Mode Display
Averaging Signals
The
AVERAGE
mode (Figure
3-1 0)
is excellent for visually eliminating ran-
dom signal noise that rides on the waveform. Acquisitions are averaged over
multiple records. The default weight of one acquisition is
%
but it may be
changed using the
ACQUISITION
menu.
Figure 3-1
0:
Average Mode Display
Sampling Signals
When you select
SAMPLE
the special features of the other modes are not
used. The acquisition displayed is composed of
100
samples per division
(Figure
3-1
1).
3-14
In Detail
 Loading...