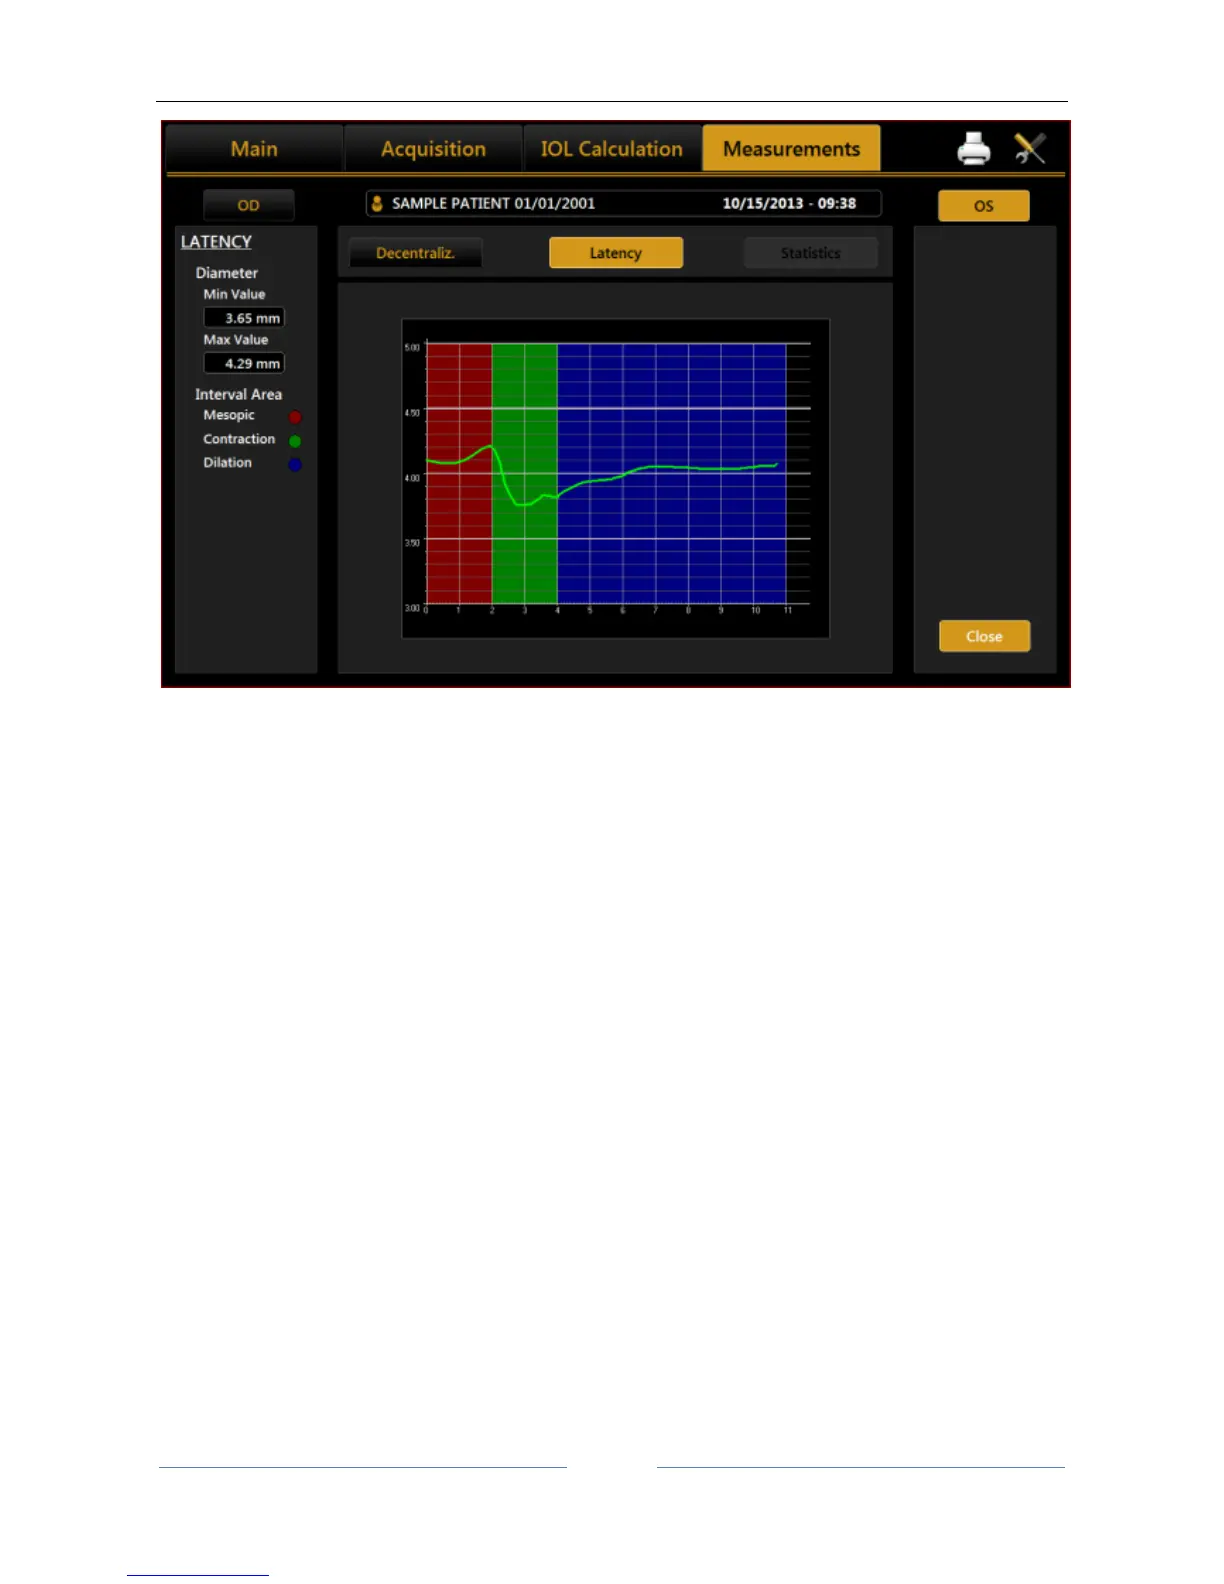
Figure 69
The graph shows the time in seconds on the abscissa and the pupil diameter in mm on the ordinate, in a scale
standardized on the maximum and minimum value recorded. Next the progression of the pupil’s diameter
over time is represented.
Taking into account that dynamic pupillometry consists of acquiring various images in variable light
conditions, from mesopic to photopic and back to mesopic, on the "Settings" screen you can set the
acquisition times for each mode (explained later). The left column shows the key to the graph.
Red for acquisition in mesopic light conditions.
Green to indicate the pupil contraction phase following a change in brightness brought about by the LEDs
coming on.
Blue for the pupil dilation phase following the change from LEDs on to LEDs off.
Remember that these graphs are only available if the acquisition of the dynamic pupillometry has been
performed.
Statistics