13.13.2 Zernike
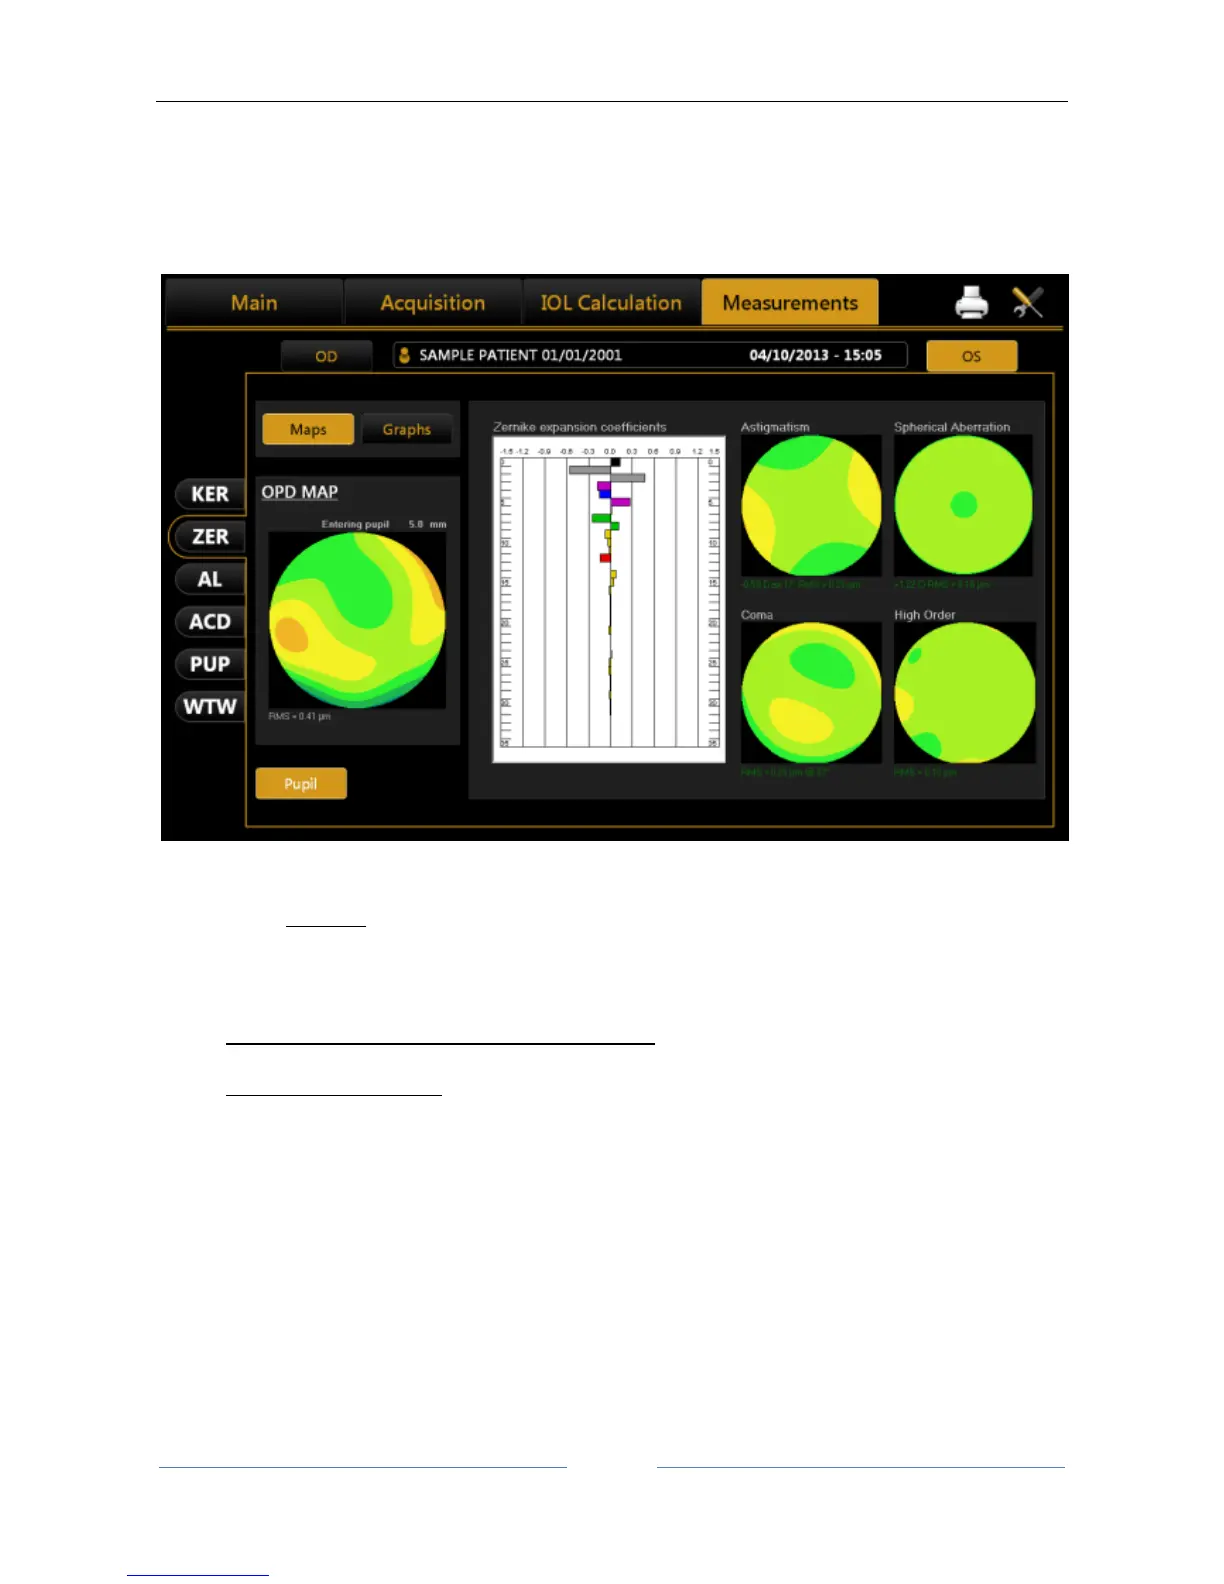
The Zernike module provides a comprehensive view of the wavefront aberrations generated by the front
surface of the cornea. The results of the Zernike axis are illustrated by means of numerical indices and graphic
representations (Figure 62).
Figure 62
Click on the “OD” or “OS” buttons to view the results of the Zernike analysis for the right or left eye.
On the left the OPD Map is detailed, representing the total aberration that corresponds to the sum of all the
aberration components and the RMS value. This allows you to quantify the deviation with respect to an ideal
wavefront.
On entering the module, the aberrations map is displayed ( “Maps” section):
Histograms of the Zernike expansion coefficients: each histogram represents the weight of the
corresponding polynomial.
Primary aberrations map:
Astigmatism: the map, the magnitude in diopters, the axis and the RMS value are displayed
Spherical aberration: the map, the quantity of longitudinal spherical aberration in diopters
and the RMS value are displayed
Coma: the map, the RMS value and the direction are displayed
High Order: all the components of a higher order than the primaries are grouped; the map
and the RMS value are displayed.
Click on “Graphs” at the top left to display the vision quality summary (Figure 63).
This section displays:
Zernike Coefficient pyramid: represents the numerical value of each coefficient by means of a grey
scale; the greater the coefficient, the greater the color contrast with the pyramid's background.
Point Spread Function: represents the intensity of the wavefront in the retina.