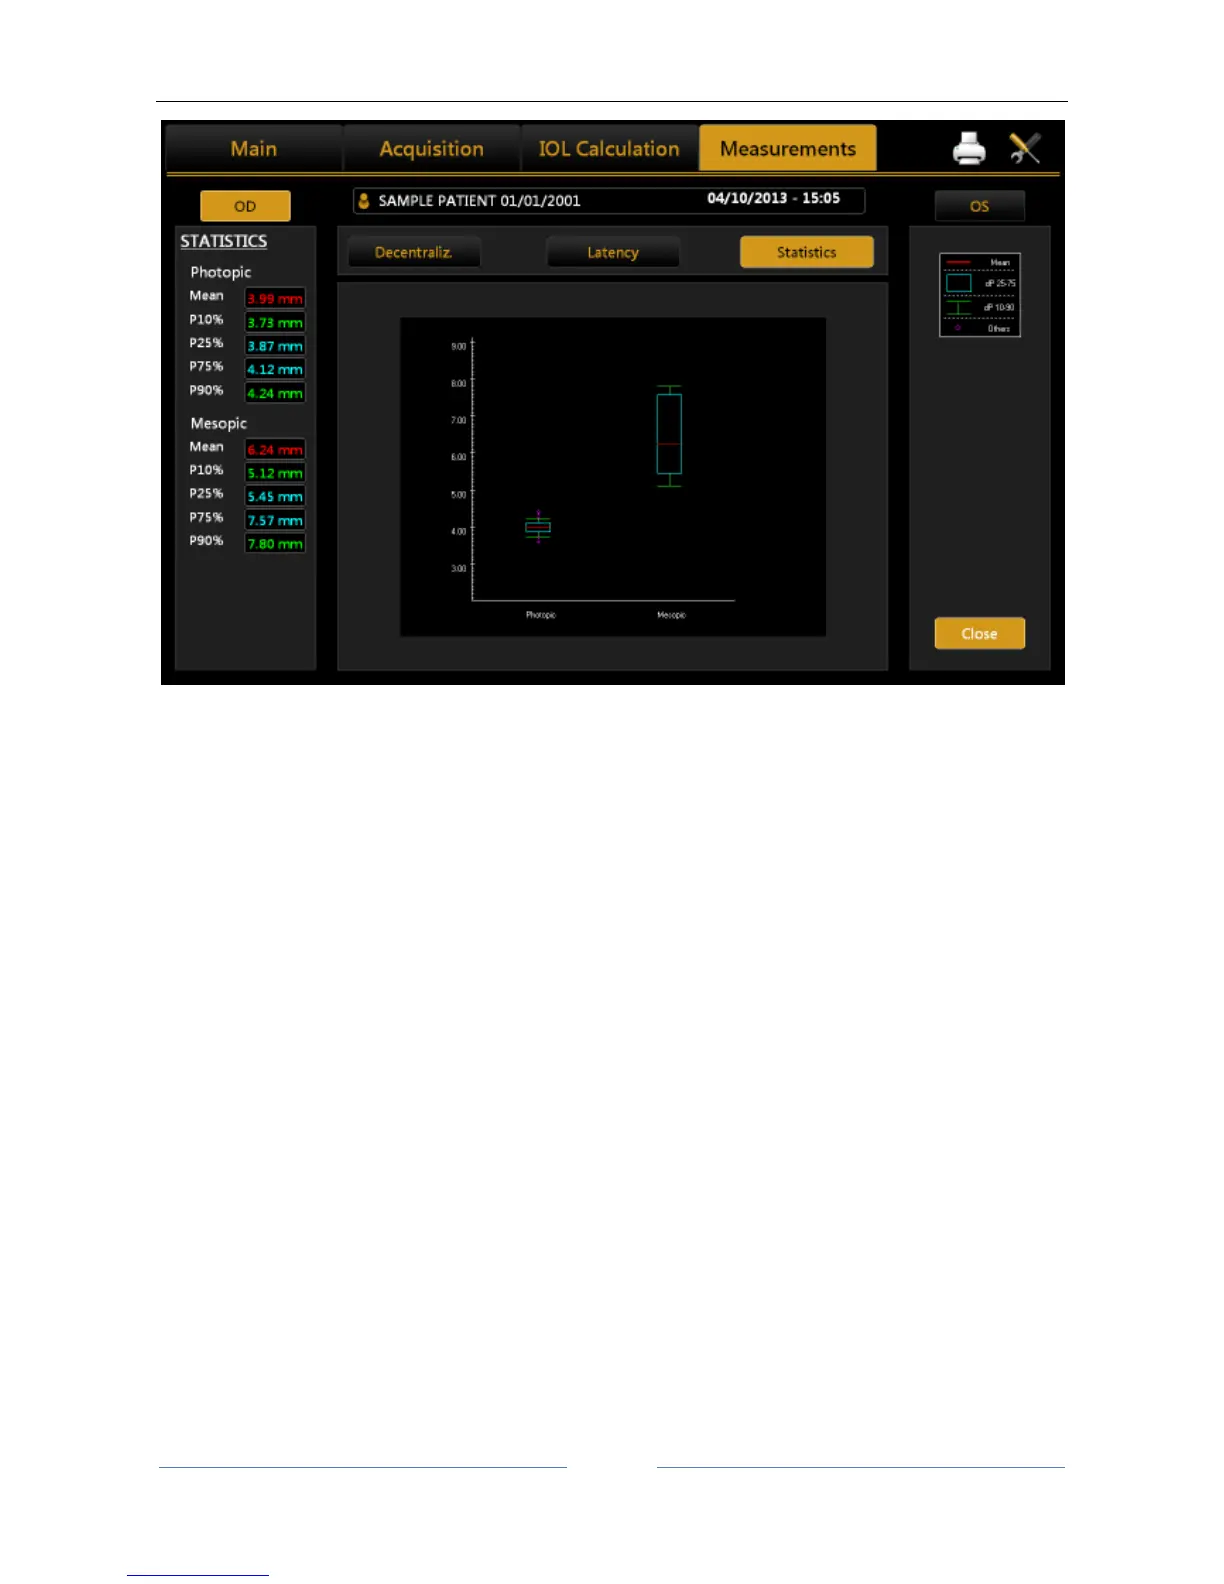
Figure 70
The graph represents the static value of the percentile of the sample for each acquisition in controlled light
conditions.
As indicated in the key on the right-hand side and by the values detailed on the left, the red line represents
the average value of the sample, the blue frame the value interval between the 25% and 75% percentiles,
the green line the value interval between the 10% and 90% percentiles, and the red circle the values outside
this interval.
The graph is displayed only if images of the pupil have been acquired in photopic or mesopic conditions.
13.13.6 WHITE TO WHITE
The White to White section allows you to view the value of the corneal diameter calculated from limbus.