36: Configuring SLA reporting on Monitor
_______________________________________________________________________________________________________
_____________________________________________________________________________________________________
© Virtual Access 2017
GW1000 Series User Manual
Issue: 1.9 Page 337 of 350
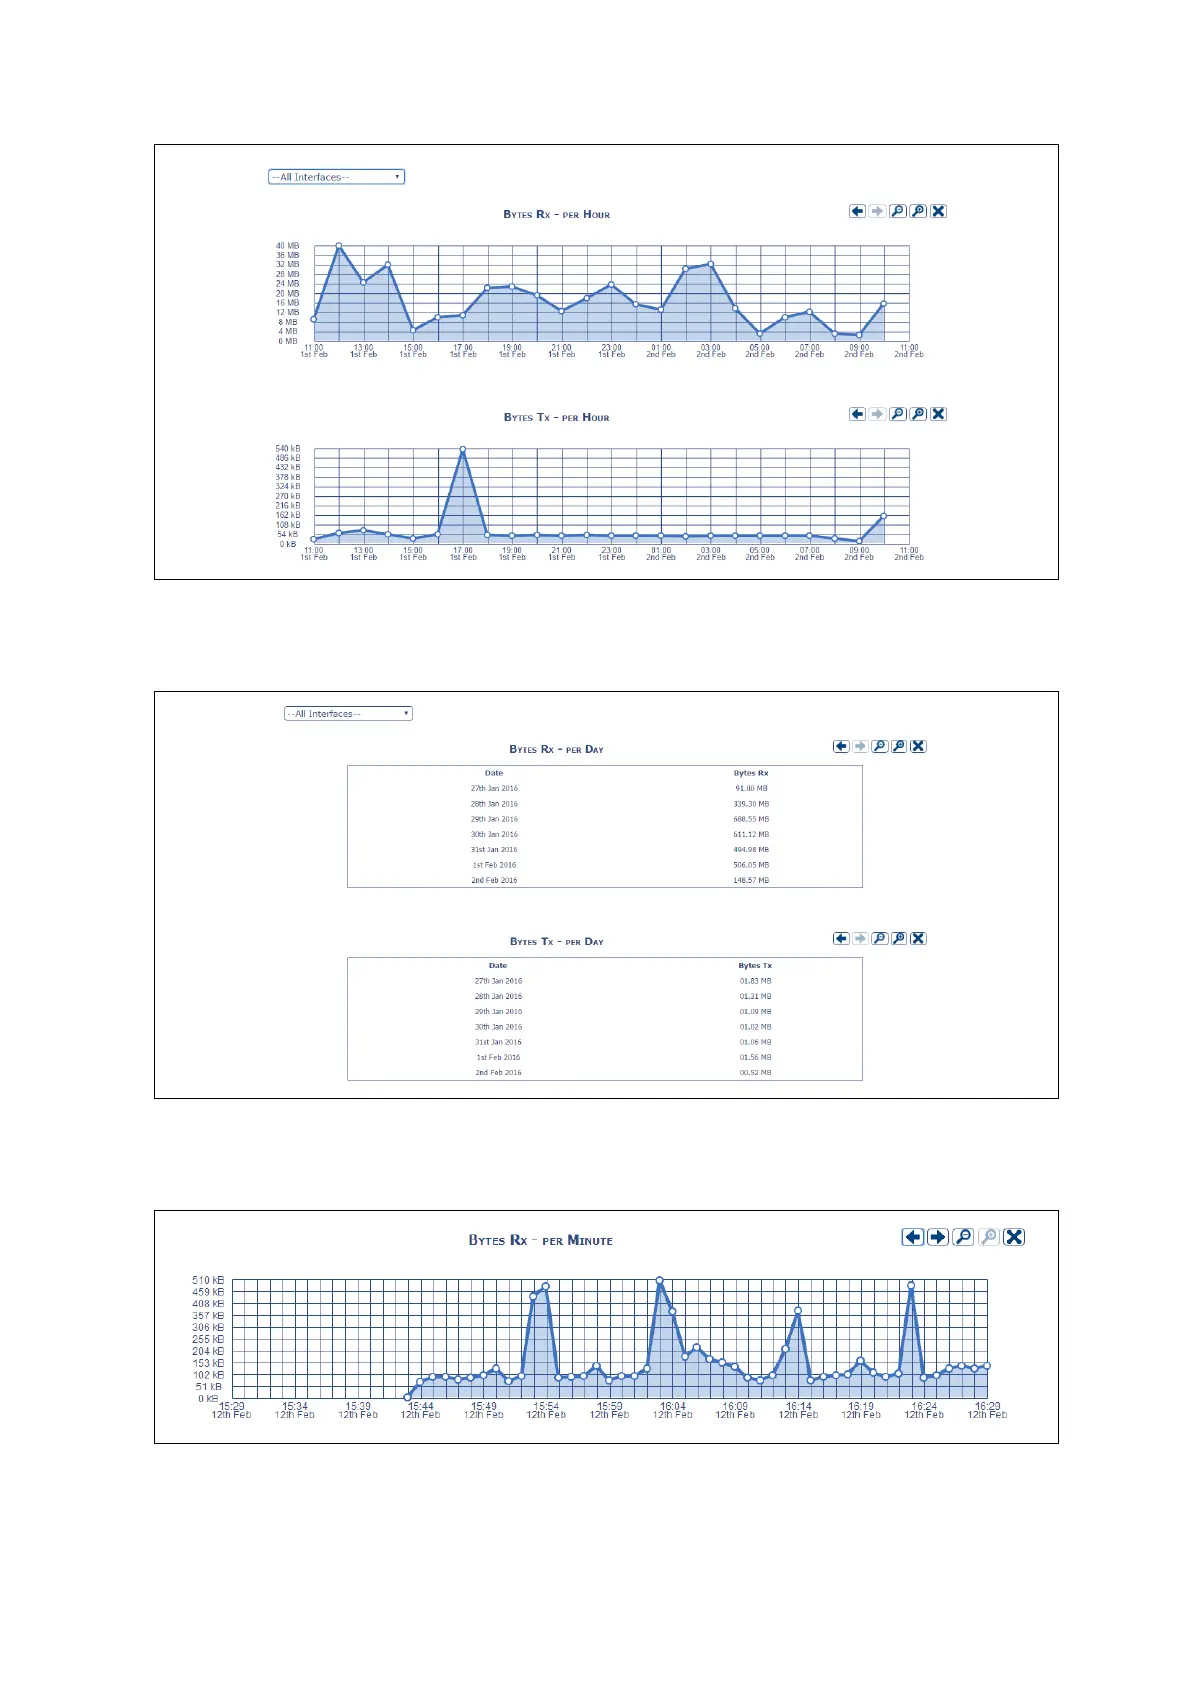
Figure 160: Graphs showing per hour data
To view raw data, click each graph to produce the following information.
Figure 161: Raw data information from each graph
To change the range of the graph, click zoom.
Figure 162: Altered range of graph information
 Loading...