36: Configuring SLA reporting on Monitor
_______________________________________________________________________________________________________
_____________________________________________________________________________________________________
© Virtual Access 2017
GW1000 Series User Manual
Issue: 1.9 Page 342 of 350
36.5.2 Statistics settings
To modify the statistics parameters, in the statics drop-down menu, select Statistics
Settings.
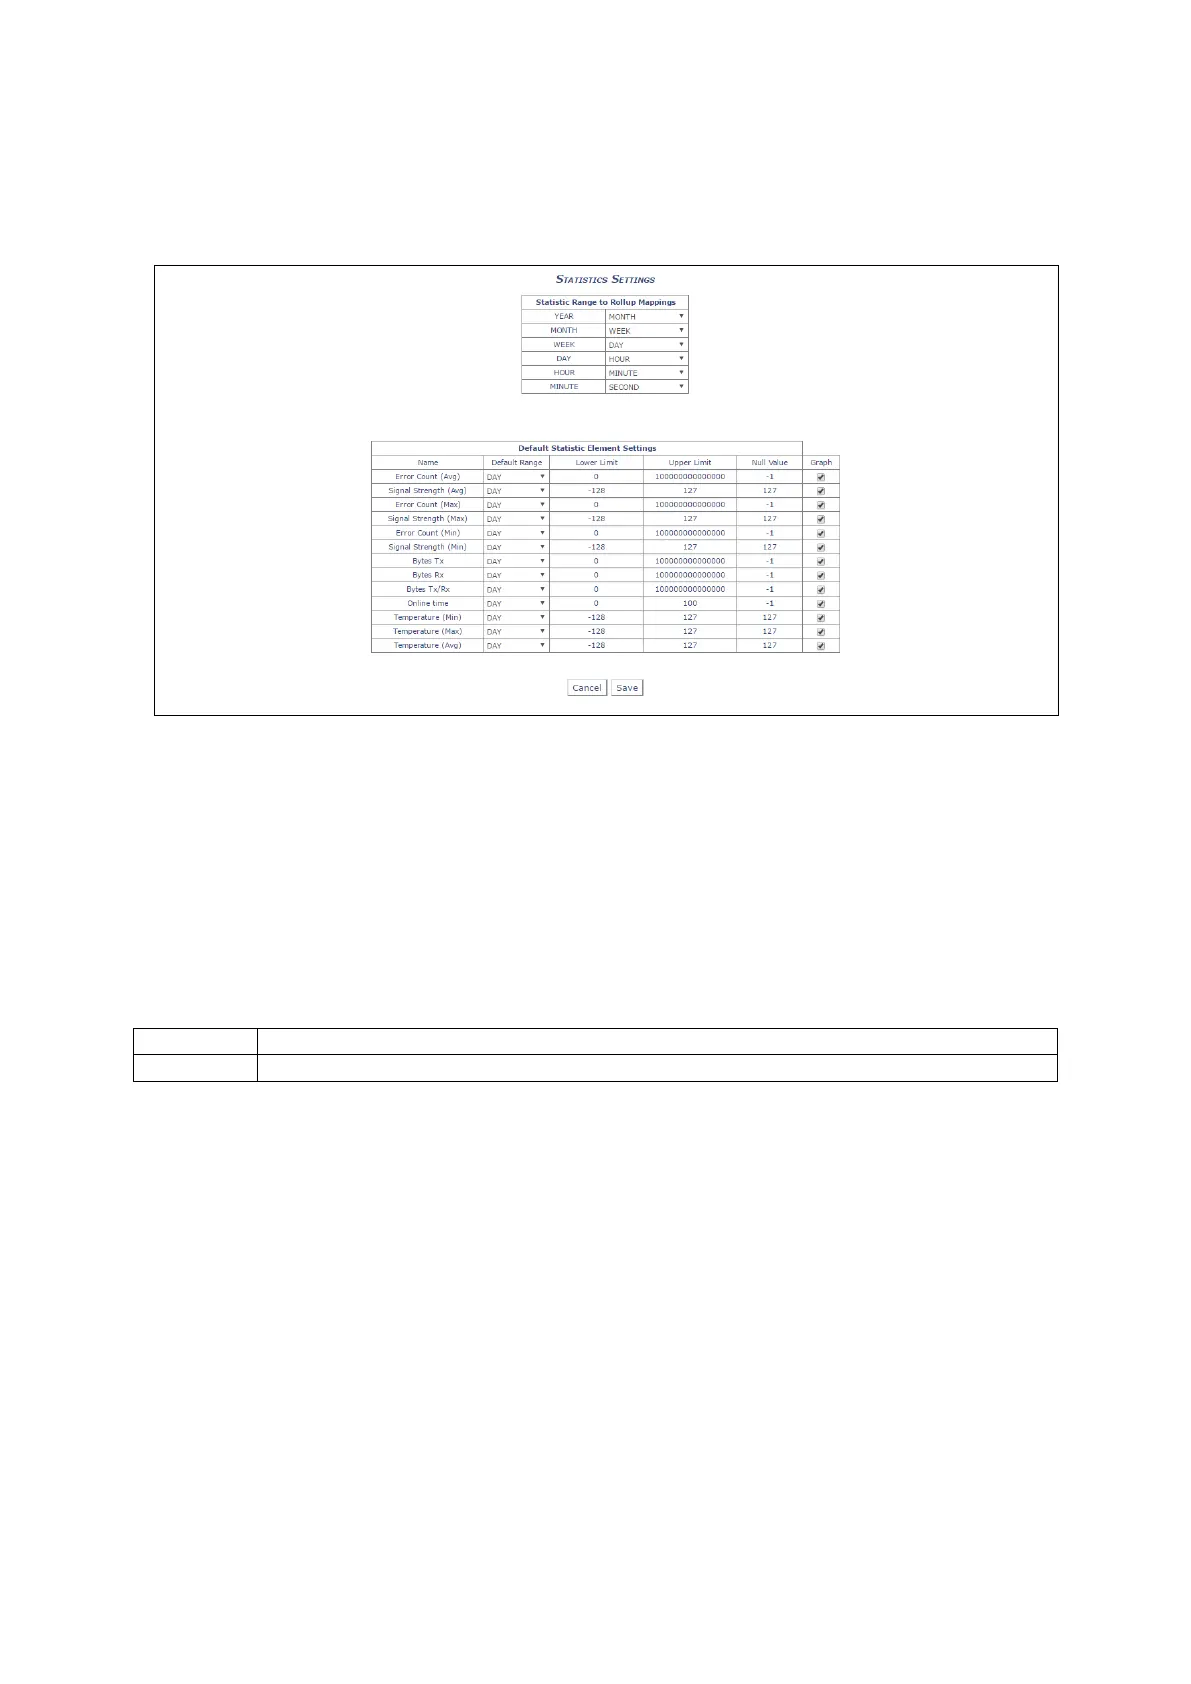
Figure 170: The statistics settings page
36.5.2.1 SLA range to rollup mappings
The SLA Range to Rollup Mappings option allows you to configure what intervals are
used for the various ranges used to display the graphs. For example, the screenshot
shows that data will be shown for every minute. If you select Day, data will be shown
for every day; if you select Week, data will be shown for every week, and so on.
36.5.2.2 Default SLA element settings
The Default SLA Element settings control range and graphs.
Sets what the default range will be when a new user is created.
Selects whteher each report element is displayed as a graph or in tabular data form.
The view of SLA data is customisable per user. These default values set how graphs
appear when you use SLA for the first time. You can then configure your view of SLA by
altering the SLA page using the various controls. These changes are remembered by
Monitor so that your view of SLA remains the same when you next return to it. Upper
and lower limits control what data is to be ignored when generating SLA graphs.
36.6 Reporting device status to Monitor using UCI
The following UCI sample contains the settings to enable the device to report its status
to Monitor. To allow Monitor to track the IP address and ongoing presence of the device,
a heartbeat SNMP trap is sent by default every minute. The router is capable of sending
SNMP in version 1, 2c and 3.
 Loading...