App-1
IM 04P03B01-01E
Appendix
App
Appendix 1 Periodic Printout Interval
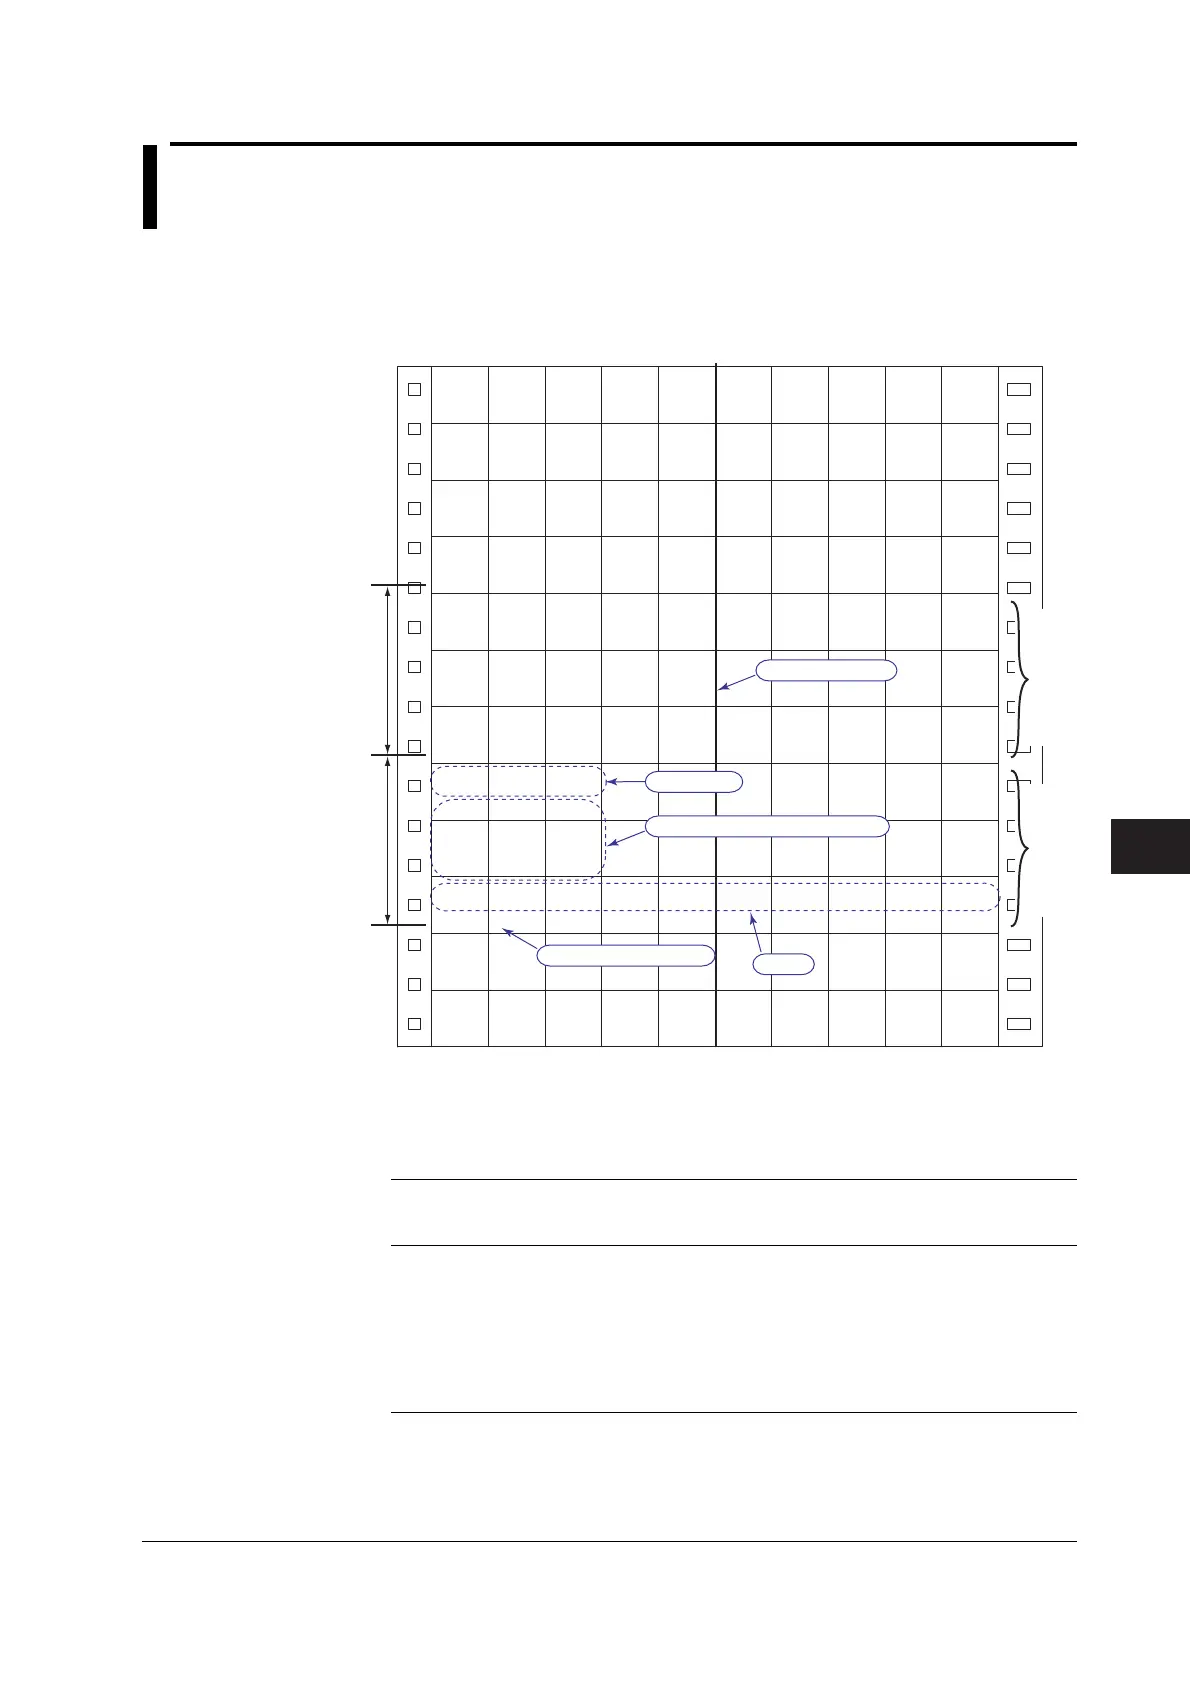
The periodic printout function prints measured values and other data numerically at the
left side of the chart paper while performing trend recording.
The periodic printout interval varies depending on the chart speed and setup conditions.
Periodic Printout Example of the Dot Model
Scale
Chart speed printout
Measured values/alarm status
Trend recording
Date/Time
Interval Interval
Periodic printout Periodic printout
Mar.31.04
08:30
1 0.001V
2 0.000V
3 0.000V
4 0.000V
5 0.000V
6 0.000V
-2.000 2.000
1CH V
20mm/h_
Mar.31.04
10:00
1 0.001V
2 0.000V
3 0.000V
4 0.000V
5 0.000V
6 0.000V
-2.000 2.000
1CH V
20mm/h_
Mar.31.04
11:30
1 0.001V
2 0.000V
3 0.000V
4 0.000V
5 0.000V
6 0.000V
-2.000 2.000
1CH V
20mm/h_
The figure above is used to explain the printout contents. The actual printout and font are
different from those illustrated in the figure. The printout positions are also slightly different.
When the Interval Is Set to Auto
Printout is performed at the interval corresponding to the chart speed.
Pen Model Dot Model
Chart Speed Periodic Printout Chart Speed Periodic Printout
Interval Interval
10 to 15 mm/h 8 hours 10 to 15 mm/h 8 hours
20 to 30 mm/h 4 hours 20 to 30 mm/h 4 hours
40 to 60 mm/h 2 hours 40 to 75 mm/h 2 hours
75 to 120 mm/h 1 hours 80 to 100 mm/h 1 hours
150 to 180 mm/h 30 minutes 120 mm/h or higher Not printed
200 to 300 mm/h 20 minutes
360 to 1500 mm/h 10 minutes
1800 mm/h or higher Not printed
Appendix
 Loading...