165
Signal Handling
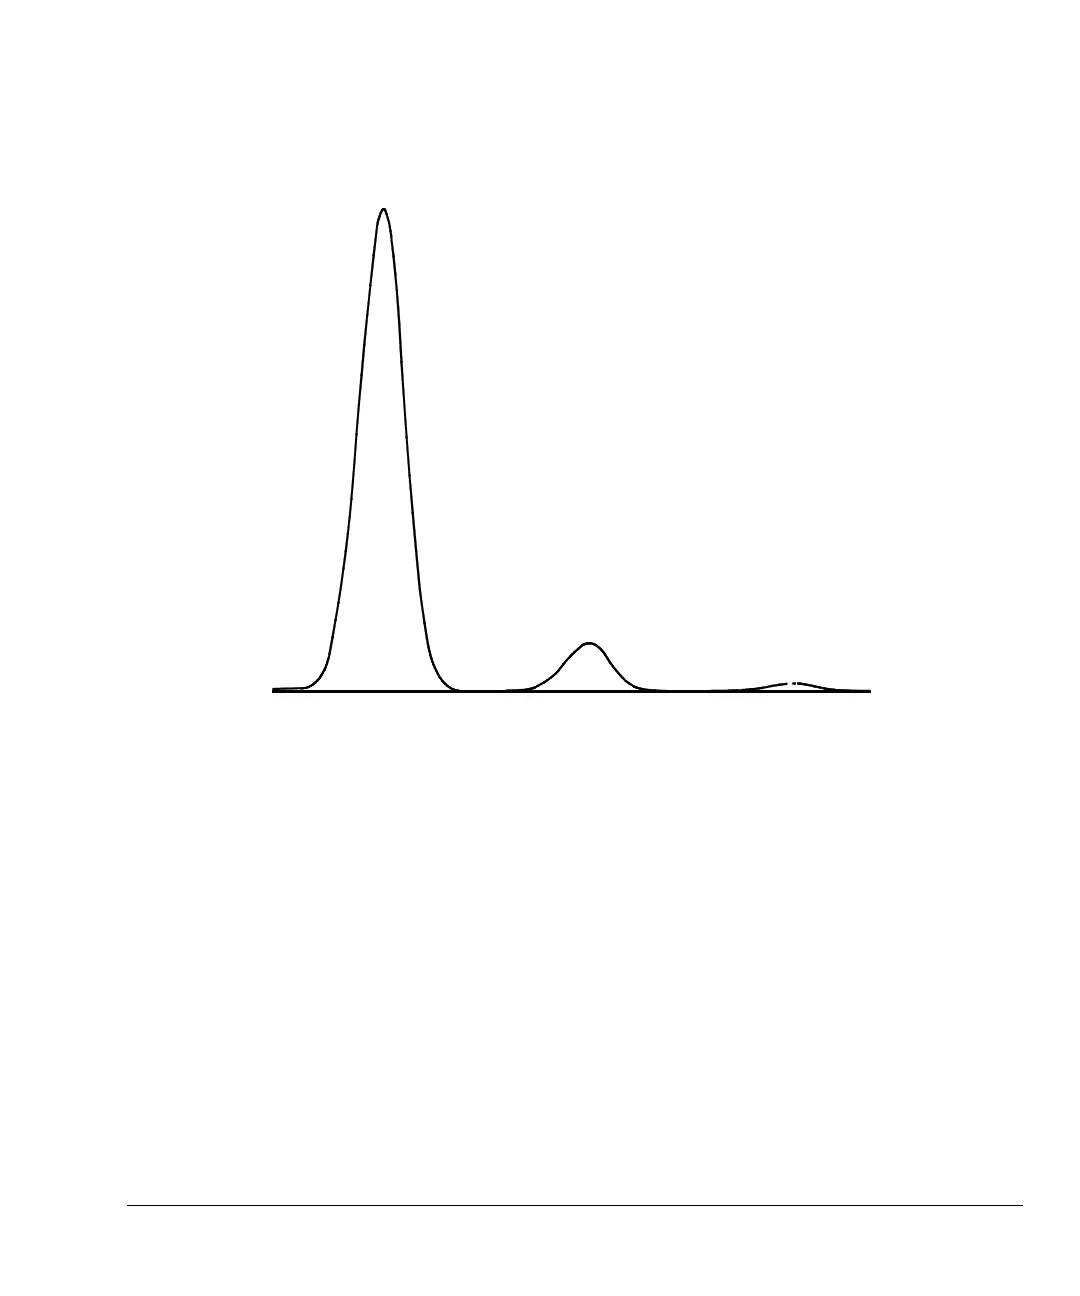
Test plot
The area of the largest is approximately 1 Volt-sec, the middle one is 0.1 times
the largest, and the smallest is 0.01 times the largest.
Test plot can be used to verify the operation of external data processing
devices without having to perform repeated chromatographic runs. It may also
be used as a stable signal to compare the results from different data processing
devices.
 Loading...