Signal Handling
Test plot
164
Procedure: Plotting a stored column compensation profile
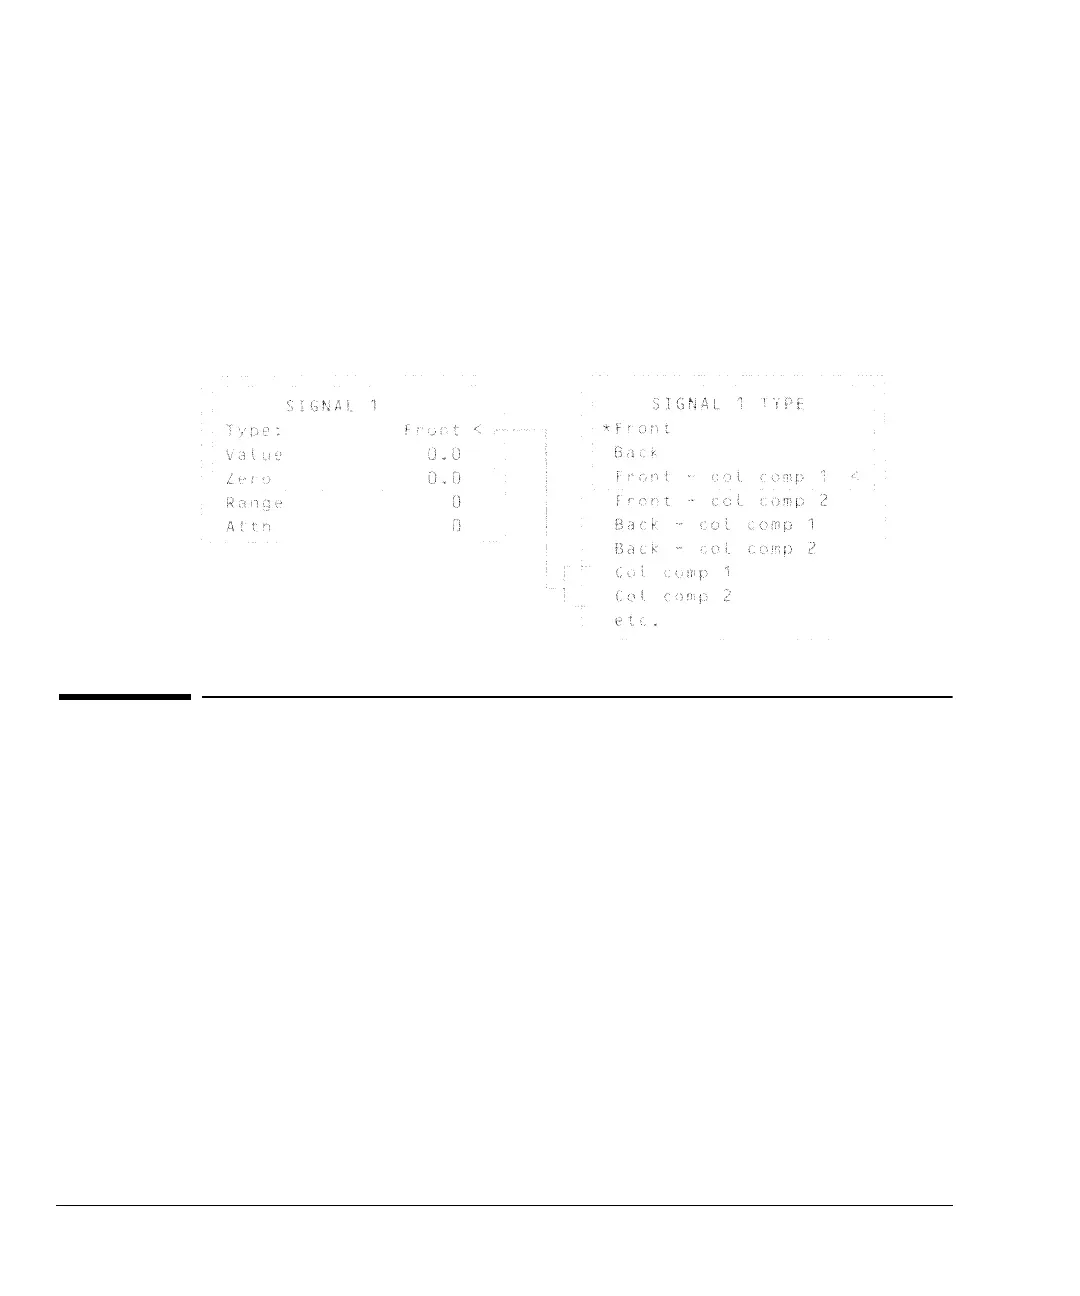
1. Press [Signal 1] or [Signal 2] to open the signal control table.
2. Scroll to Type: and press [Mode/Type].
3. Choose Col comp 1 or Col comp 2.
4. Press [Start].
Test plot
Test plot is an internally generated “chromatogram” that can be assigned to
a signal output channel. It consists of three baseline-resolved, repeating peaks.
Press [Mode/Type].
 Loading...