180 Rockwell Automation Publication 1441-UM001B-EN-P - September 2012
Chapter 6 Multi-channel Measurements
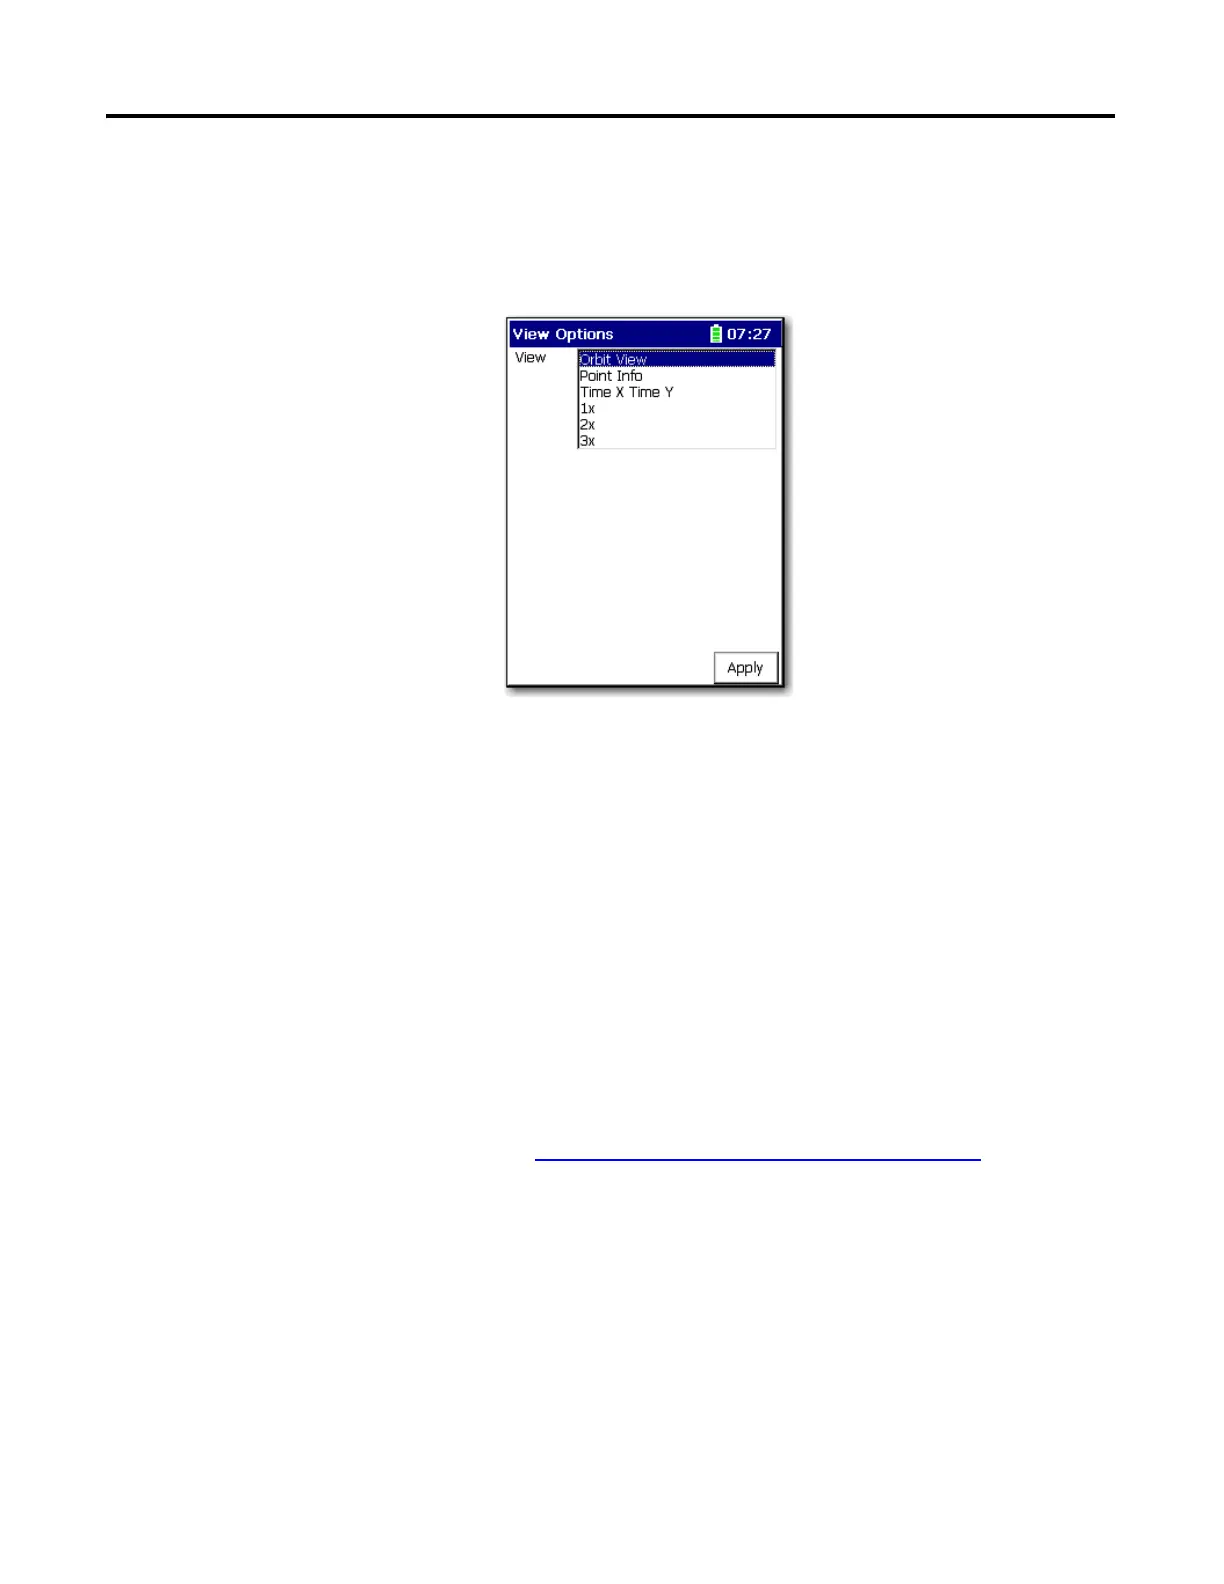
Follow these steps to display the view options for orbit measurements.
1. Press 0 (Shift) to display the second set of functions.
2. Press F4 (View).
3. Select an options and click Apply.
4. Use the Left and Right arrows to move the frequency cursor.
5. Use the Up and Down arrows to move the amplitude cursor.
The Y-axis and X-axis are synchronized, which means the cursors are in the
same position on each trace in the spectrum. The X and Y axis will move
together, and magnify as the display is expanded.
6. Press the +/- key to expand and compress the time waveform spectrum
plot.
7. If desired, press F3 (Notes) to assign inspection codes to each point.
The Dynamix 2500 data collector unloads the inspection codes when you
unload the unscheduled data to the Emonitor software.
See Inspection Codes and the Data Collector on page 105
for more
information.
8. Once the Dynamix 2500 data collector collects the measurement, press
Enter to accept the measurement.
9. When you are finished viewing the data, press Enter or press F4 (Esc) to
return to the Data Collection screen.
Review Route Data
Follow these steps to review route data.
 Loading...