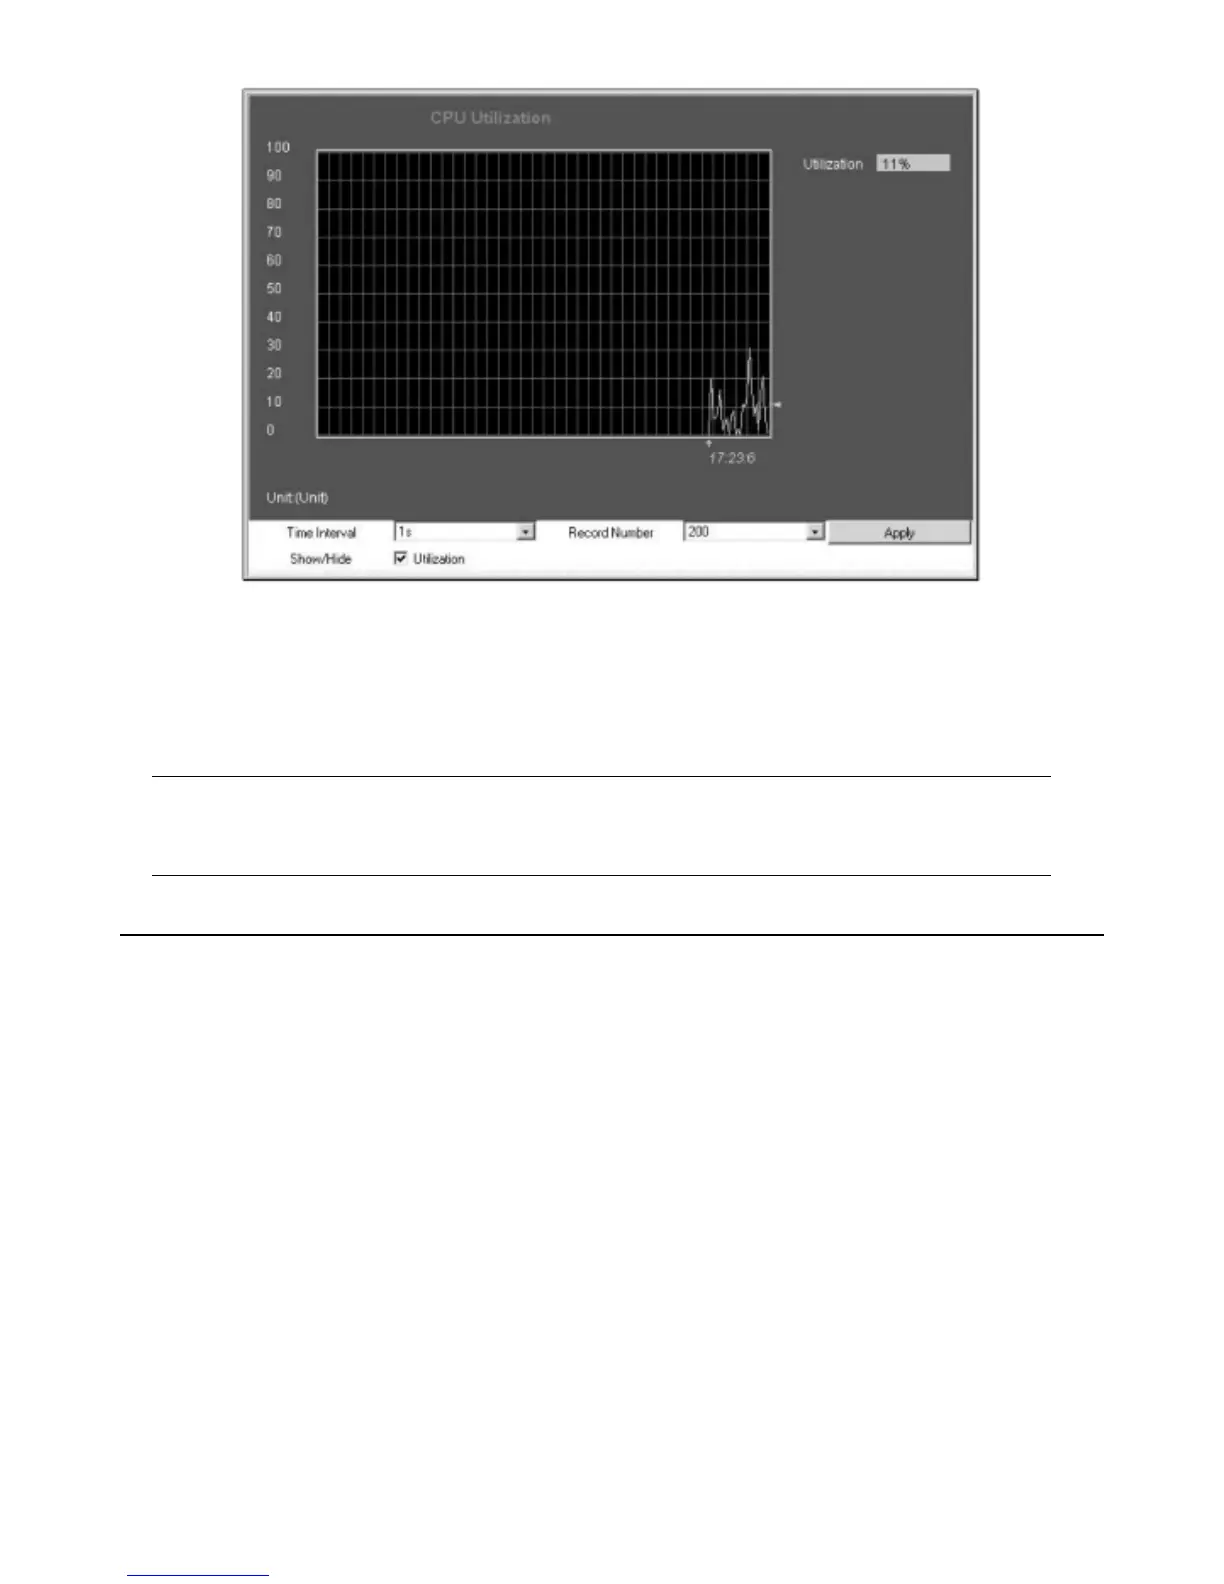
Figur
e 9- 2. CPU Utilization graph
Click
Apply to implement the configured settings.The window will automatically refresh with new updated statistics.
The information is described as follows:
Parameter Description
Time Interval
Select the desired setting between 1s and 60s, where "s" stands for seconds.The default value is one second.
Record Number Select number of times the Switch will be polled between 20 and 200.The default value is 200.
Utilization Check whether or not to display Utilization.
9-3 Packets
The
Web Manager allows various packet statistics to be viewed as either a line graph or a table. Six windows are offered.
Received (RX)
Click the Received (RX) link in the Packets folder of the Monitoring menu to view the following graph of packets received on the Switch.To select a port
to view these statistics for, first select the Switch in the switch stack by using the
Unit pull-down menu and then select the port by using the Port pull down
menu.The user may also use the real-time graphic of the Switch and/or switch stack at the top of the web page by simply clicking on a port.
157
Allied Telesyn AT-9724TS High-Density Layer 3 Stackable Gigabit Ethernet Switch

 Loading...