Zone graphics
(DEVICE MENU, 4, )
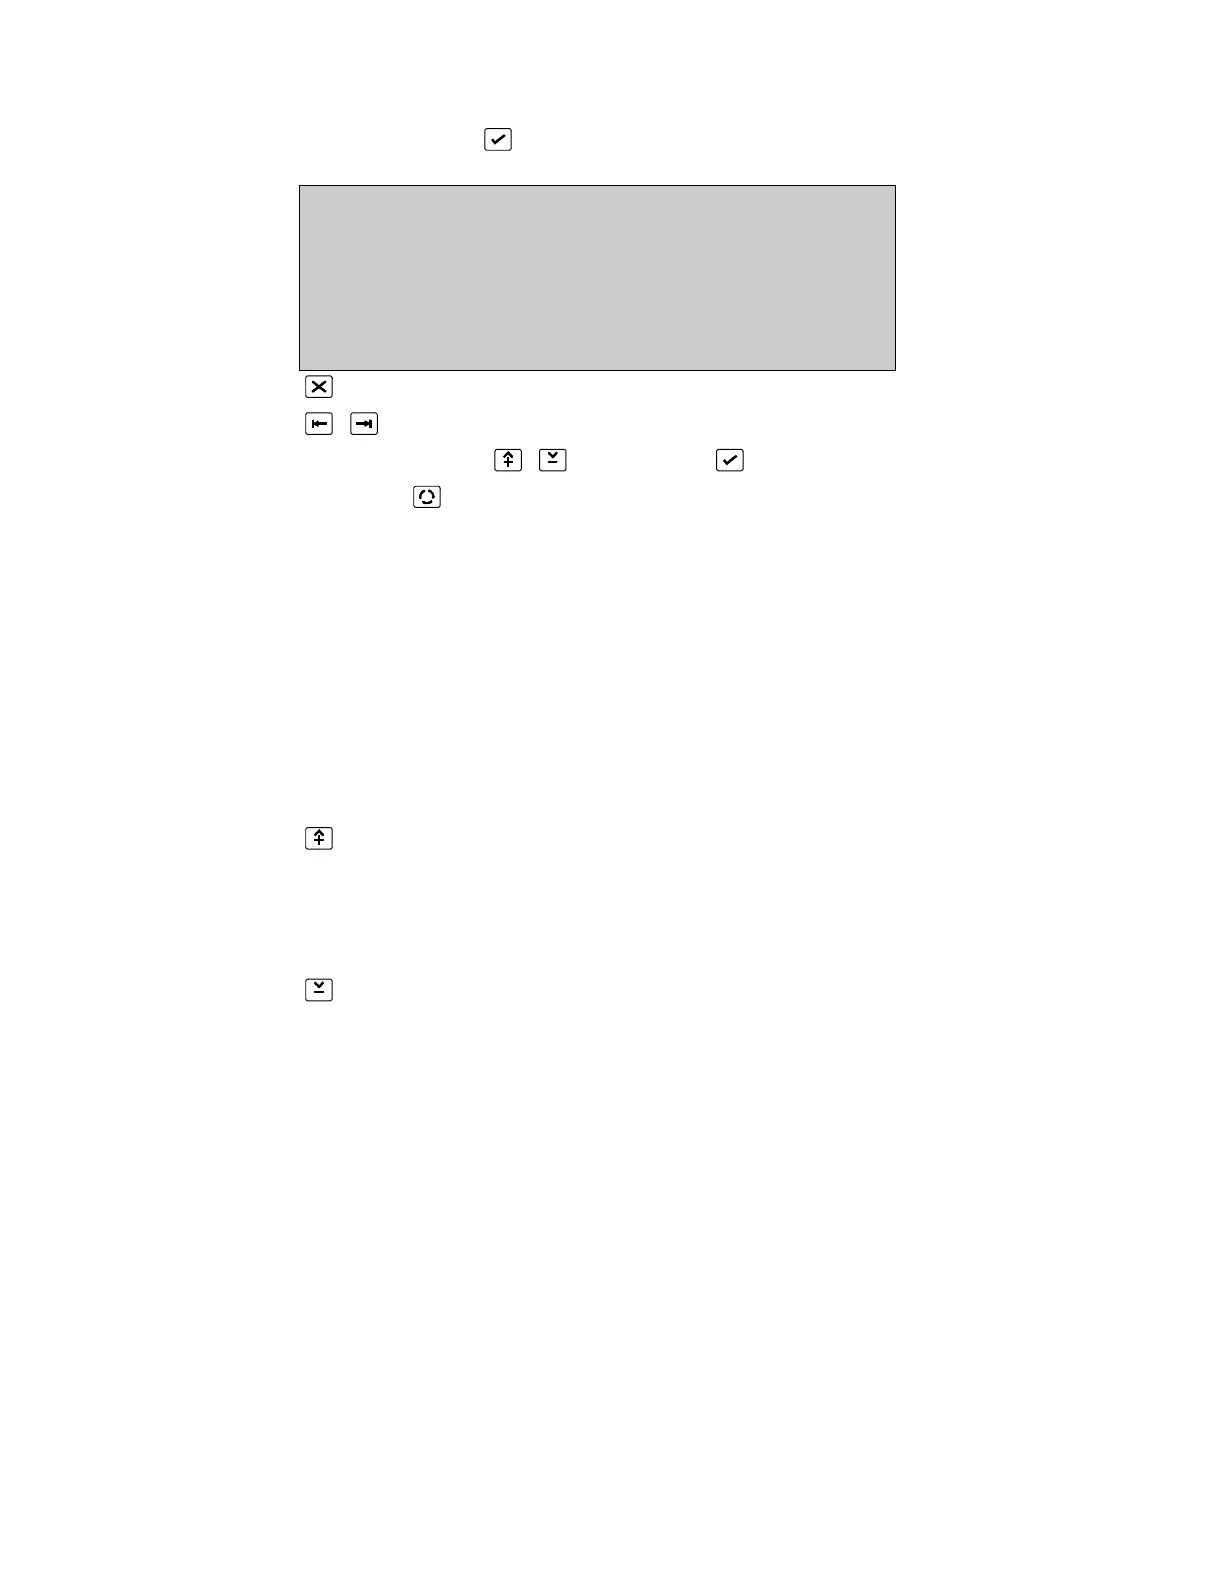
ZONE GRAPHICS
Zone :1
Disp :Value
more 0. .9, ^V, <>, E, X
Alarms: 0 Faults: 0 Cond.: 0 P: 1 SDZ
Return to Device Menu Page 78
Select field to be changed
Enter number 0..9 or to change data Confirm entry
Press [More ] to view Graphic Screen Page 102
The state of smoke and heat detectors in a zone can be viewed in bar graph form. This
assists in obtaining an overall view of the condition of a zone.
The statistics of a particular smoke or heat detector in the zone can be obtained by
selecting the device from the graphic screen.
Zone: Select zone to be viewed
Disp: Select the parameter to be viewed on the bar graph
Value - The current values of the devices
Average - The average value of the devices
Test Val - The device test values
High - Highest value achieved by each device
Low - Lowest value achieved by each device
Contam - % Contamination of each device
CommQlt - % Communication quality of each device
*See Page 83, Device Statistics
 Loading...