Baumer Web interface operation | 9
V2 | OX100 Operating Manual 37
9 Web interface operation
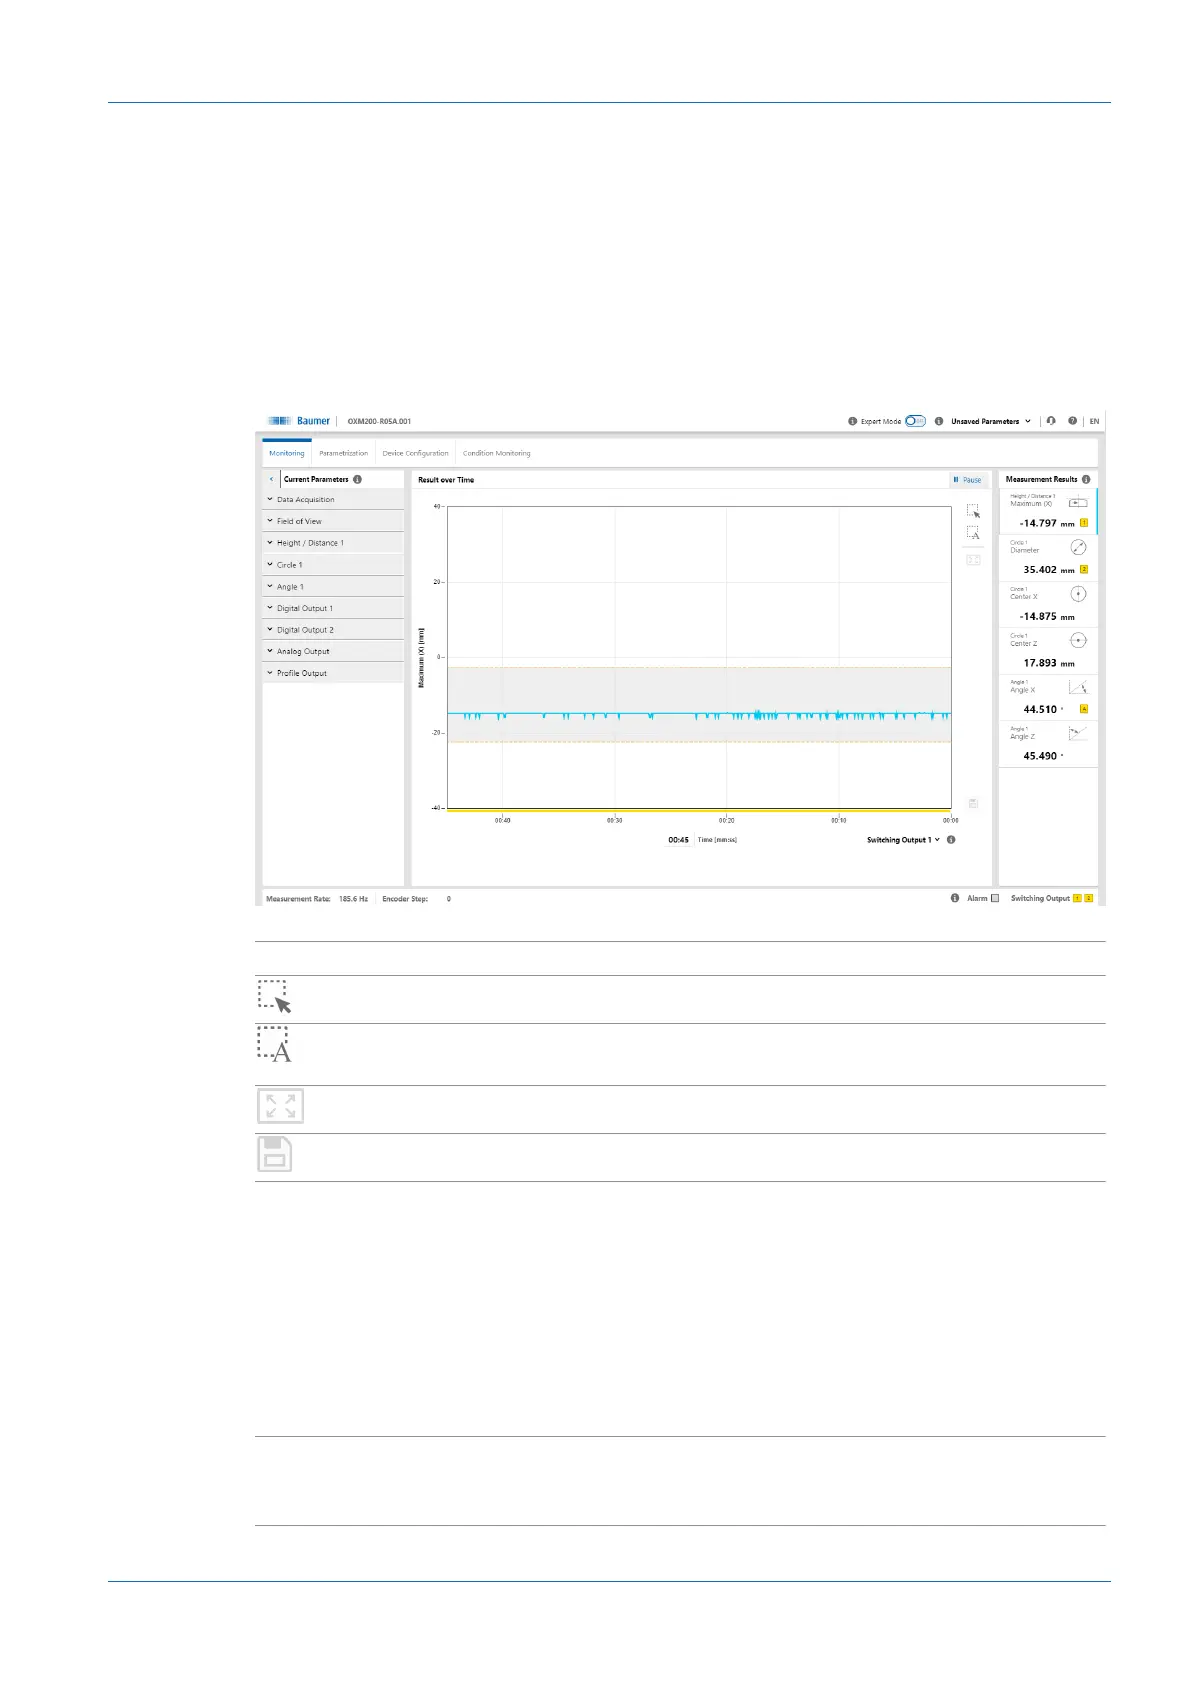
9.1 Mode Monitoring
In Monitoring mode, the time curve of the measured value selected in the Measurement Re-
sults window (see Window Measurement Results [}36]) is displayed in the visualisation area.
In addition, there are various setting options for the display of the measured values. The grey
background and the dotted orange lines indicate the switching output window or the switching
point.
In Monitoring mode, no parameters can be changed.
Ill.12: Web interface – Monitoring mode
II Pause
n
Visualisation is stopped.
n
Scaling of the measured value display by expanding the view.
n
Automatic, dynamic scaling of the measured value display de-
pending on the displayed data.
n
Reset scaling.
n
Save measured values as a CSV file.
Signal
n
Selection of the signal quality and the visualised switching
states via a drop-down list:
▪ Signal quality:
Green: valid signal
Yellow: weak signal
Red: no signal (no valid measured value)
▪ Switching output:
Yellow: switching output is active
Grey: switching output is inactive
Time [mm:ss]
n
Setting the time period in which the measured values are dis-
played (can be freely selected). The set time period applies to
all defined measured values.