Baumer Web interface operation | 9
V2 | OX100 Operating Manual 39
9.2.1 Changing the view
You have a choice of 5 different views for display of the measured values in the visualisation
area (in Parametrization mode). The views offer you the information required for parametrisa-
tion of the respective situation. To change the view in the visualisation area, proceed as follows:
Instruction:
w Select the desired view in the drop-down menu on the top left of the visualisation area.
You can choose from the following views:
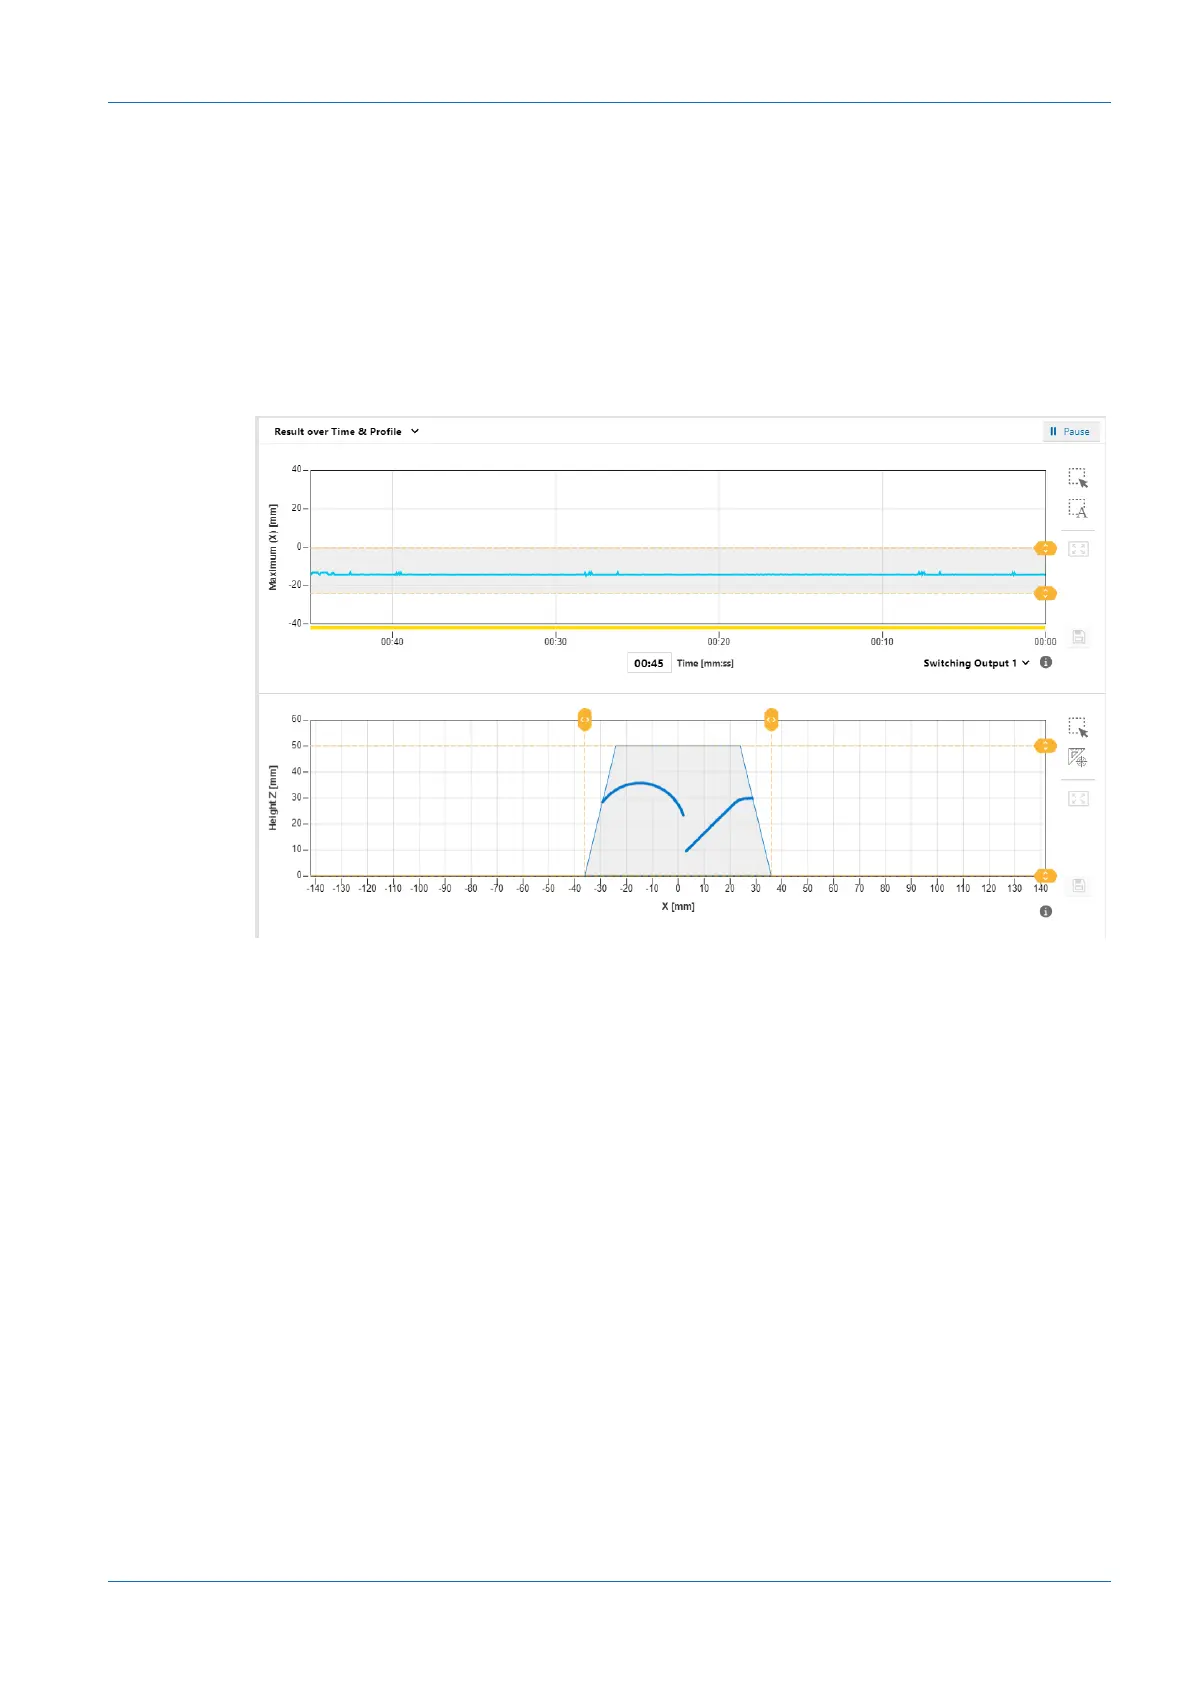
Result over Time & Profile
Ill.14: Web interface – Parametrisation mode – Result over Time & Profile view
The above diagram shows the time curve of the measured value selected in the Measurement
Results window. The grey background and the dotted orange lines indicate the switching output
window or the switching point. This diagram corresponds to the view in the Monitoring mode
(see Mode Monitoring [}37]).
The bottom diagram shows the profile points of the object. The field of view comes with a grey
background. Saving the measured data does not include the profile points (x-z). You can narrow
down the measurement field by drag & drop and the yellow lines. The change is immediately
adopted.As soon as the measurement field has been narrowed down, any area outside the
measurement field is no longer available for further processing.
Optionally, the displayed profile can be saved as a CSV file via the web interface. The CSV file
stores the profile points (x-z) in mm units and a timestamp from the host. For doing so proceed
as follows:
a) In the visualisation area click the button IIPause.
ü The currently displayed measured data are frozen.
b) Click the diskette symbol in the visualisation area to the right of the profile graph.
c) The file is saved in the .csv format.