Baumer Web interface operation | 9
V2 | OX100 Operating Manual 41
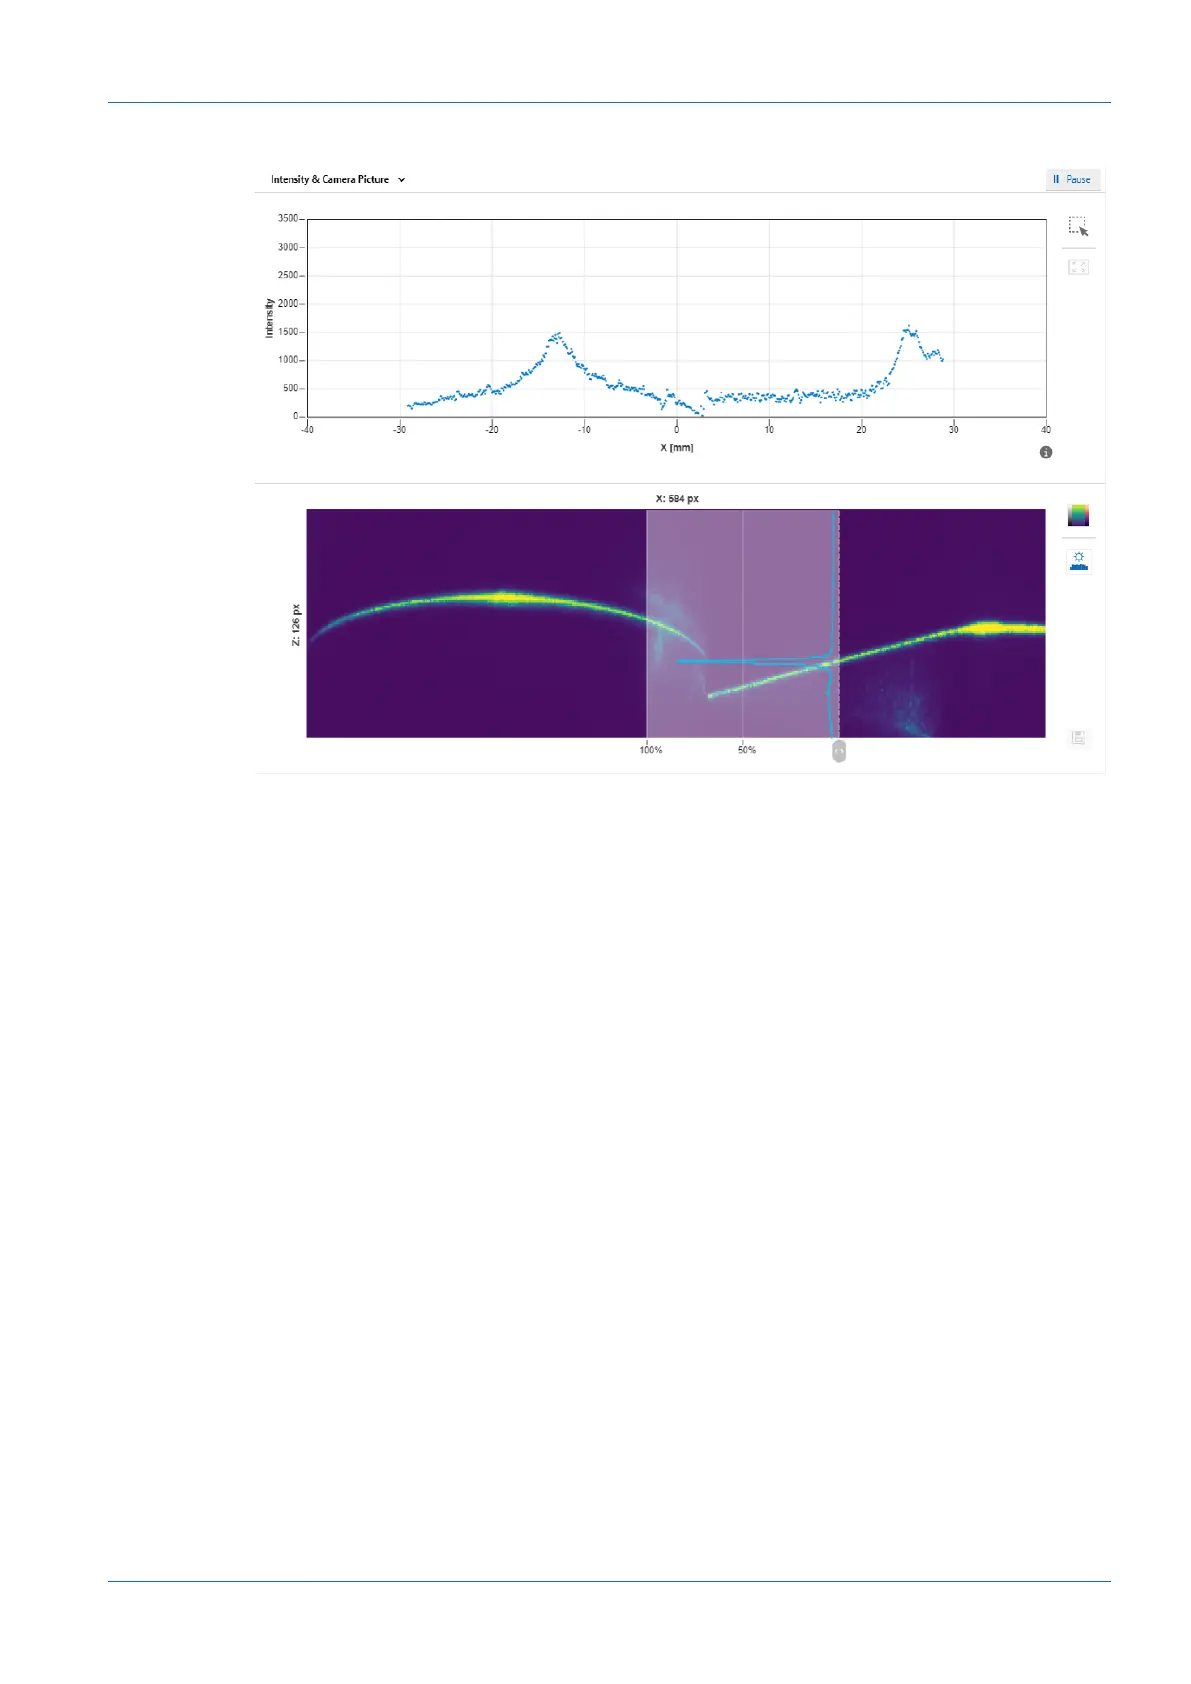
Intensity & Camera Picture
Ill.16: Web interface – Parametrisation mode – Intensity & Camera Picture view
The top diagram is a measure of the intensity of the pixels along a column. This view allows you
to recognise artefacts in the profile graph and to trace them back to the structure of the surface.
The bottom diagram shows the camera image. This diagram corresponds to the bottom diagram
in the Profile & Camera Picture view.
The web interface offers the option of saving the displayed profile as a PNG file containing the
unprocessed camera image. For this process, proceed as follows:
a) In the visualisation area click the button IIPause.
ü The currently displayed measured data are frozen.
b) Click the diskette symbol in the visualisation area to the right of the camera image.
c) The file is saved in the .png format.