9 | Web interface operation Baumer
42 Operating Manual OX100 | V2
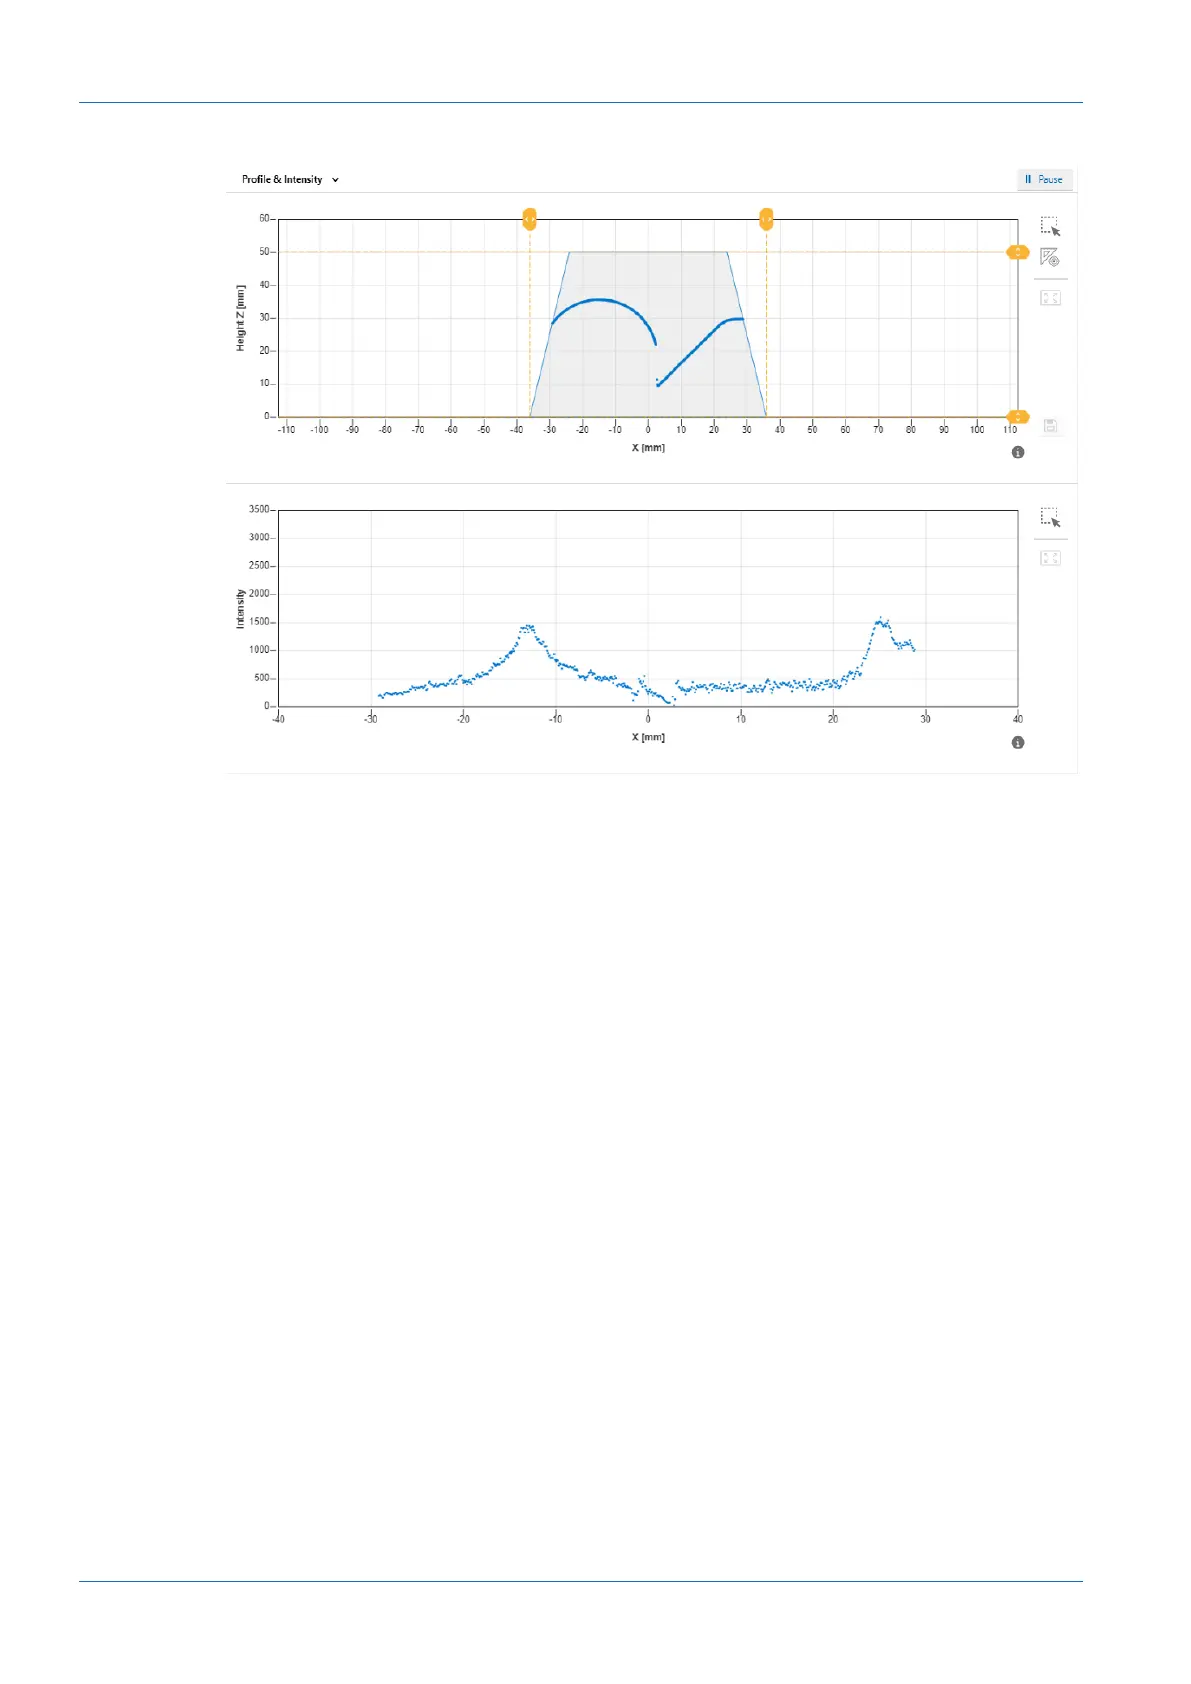
Profile & Intensity
Ill.17: Web interface – Parametrisation mode – Profile & Intensity view
The top diagram shows the profile points of the object. This diagram corresponds to the bottom
diagram in the Result over Time & Profile view.
The bottom diagram shows the summarised pixel values along a column. This diagram corre-
sponds to the top diagram in the Intensity & Camera Picture view.