Data Analysis Windows
98
• Preview pane (right side of window). View the current report in a preview
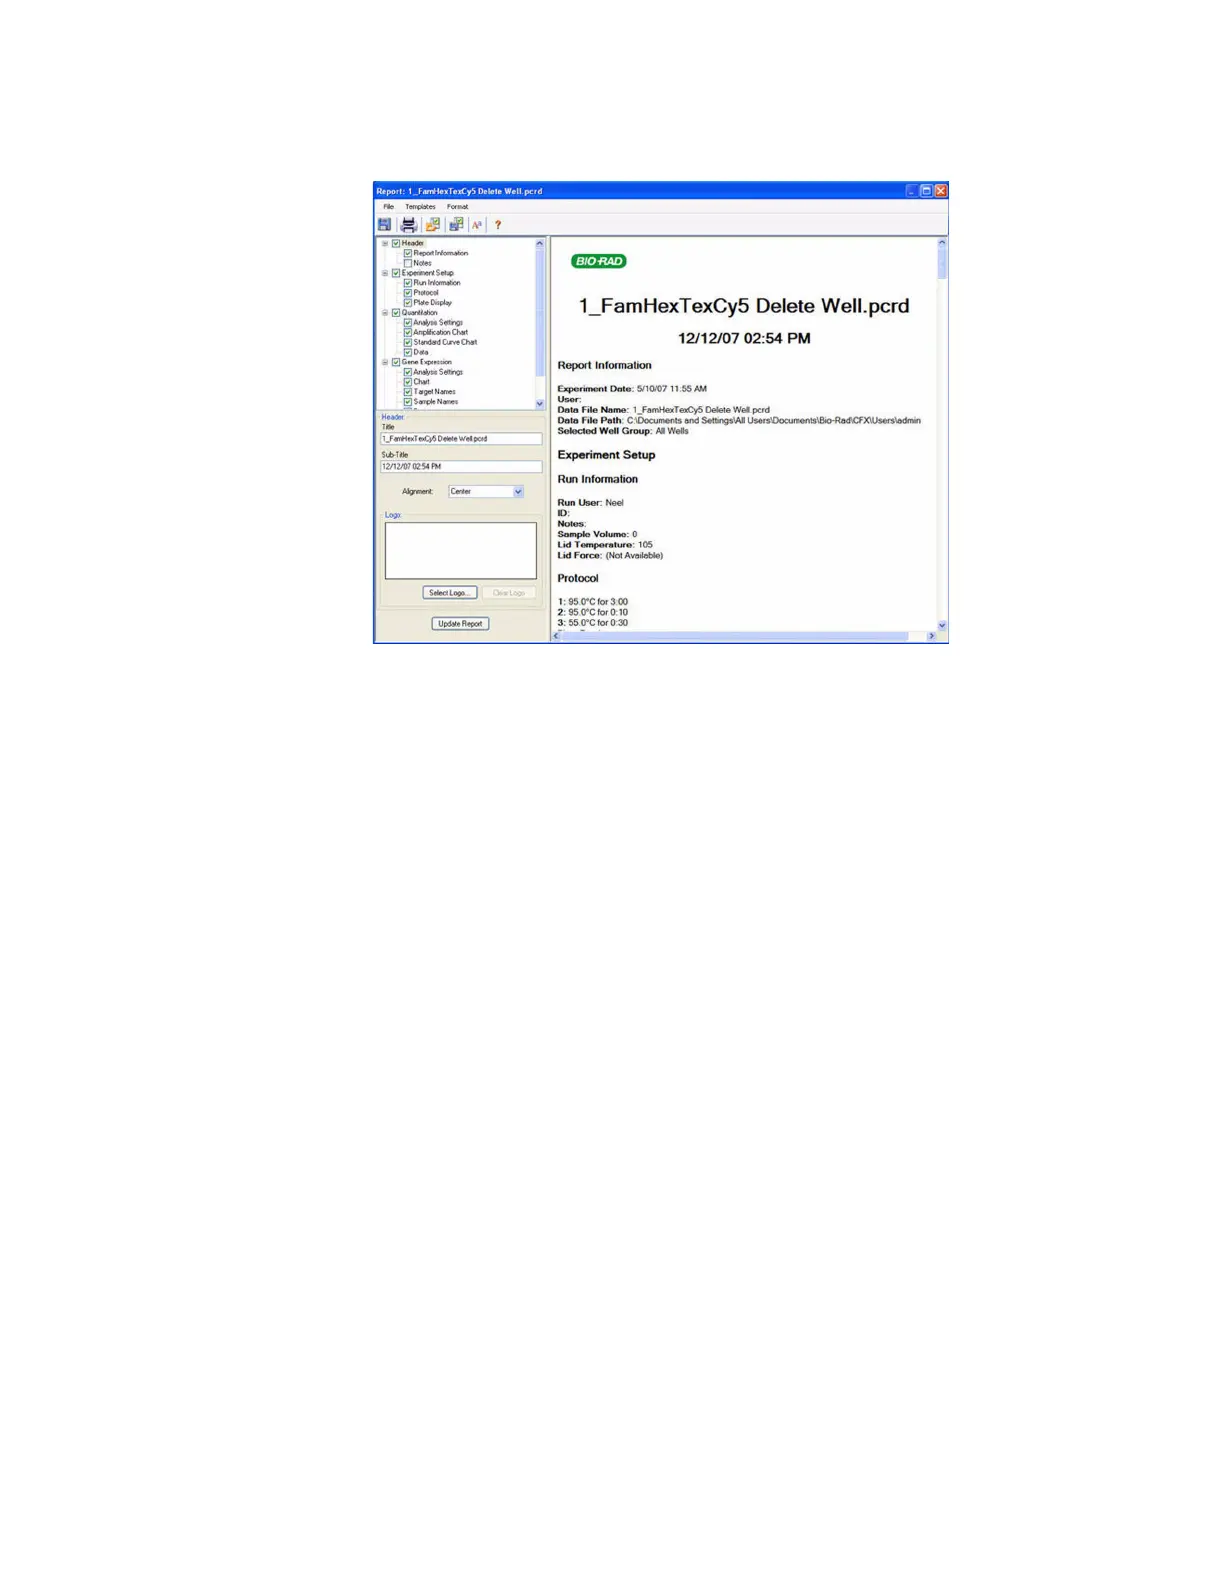
Figure 97. Example of a Report window for a data file.
TIP: The layout of the report can define the type of information that appears in any
report if you save the report as a template. Select Te m p l a te > Sa ve or Save As to
save the layout of the current report as a template.
Create a Data Analysis Report
To create a report in the Data Analysis window, follow these steps:
1. Make final adjustments to the well contents, selected wells, charts, and spreadsheets in
the Data Analysis window before creating the report.
2. Click the Report button in the Data Analysis toolbar to open the Report window.
3. Change the options you want to include in the report. The report opens with default
options selected. Click the check boxes in the report options list to change whole
categories or individual options within a category.
NOTE: The data that appear in the report are dependent on the current selections
within the tabs of the Data Analysis window. For example, a quantitation
experiment might not contain a standard curve, and therefore those data do not
appear in the Data Analysis window or in the data report.
4. Click the Update Report button to update the Report Preview with any changes.
5. Print or save the report. Click the Print button in the toolbar to print the current report.
Select File > Save to save the report as a PDF (Adobe Acrobat Reader file), MHT
(Microsoft document), or MHTML (Microsoft document) formatted file and select a
location to store the file. Select File > Save As to save the report with a new name or in a
new location.
6. (Optional) Create a report template with the information you want. To save the current
report settings in a template, select Te m p l a te > Sa ve or Save As. Then load the report
template the next time you want to make a new report.

 Loading...