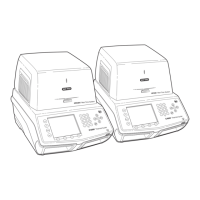
CFX96 and CFX384 Systems Manual
99
Data Analysis Report Categories
A report can include any of the options in each category described in Table 36, depending on
the type of data in Data Analysis window.
Table 36. Data analysis report categories in the options list
Category Option Description
Header Title, subtitle and logo for the report
Report Information Experiment date, user name, data file
name, data file path, and selected well
group
Notes Notes about the data report
Experiment Setup
Run Information Includes the experiment date, user, data
file name, data file path, and the selected
well group
Protocol Text view of the protocol steps and
options
Plate Display Show a plate view of the information in
each well of the plate
Quantitation
Analysis Settings Includes the step number when data
were collected, the analysis mode, and
the baseline subtraction method
Amplification Chart Copy of the amplification chart for
experiments that include quantitation
data
Standard Curve Chart Copy of the standard curve chart
Data Spreadsheet listing the data in each well
Gene Expression
Analysis Settings Includes the analysis mode, chart data,
scaling option, and chart error
Chart Copy of the gene expression chart
Target Names Chart of the names
Sample Names Chart of the names
Data Spreadsheet listing the data in each well
Melt Curve
Analysis Settings Includes the melt step number and
threshold bar setting
Melt Curve Chart Copy of the melt curve chart
Melt Peak Chart Copy of the melt peak chart
Data Spreadsheet listing the data in each well
Allelic Discrimination
Analysis Settings Includes display mode, fluorophores,
cycle, thresholds, and normalized data
Chart Copy of the allelic discrimination chart
Data Spreadsheet listing the data in each well

 Loading...