149
kk
kk
k Scroll
You can scroll a graph along its x- or y-axis. Each time you press f, c, d, or
e, the graph scrolls 12 dots in the corresponding direction.
kk
kk
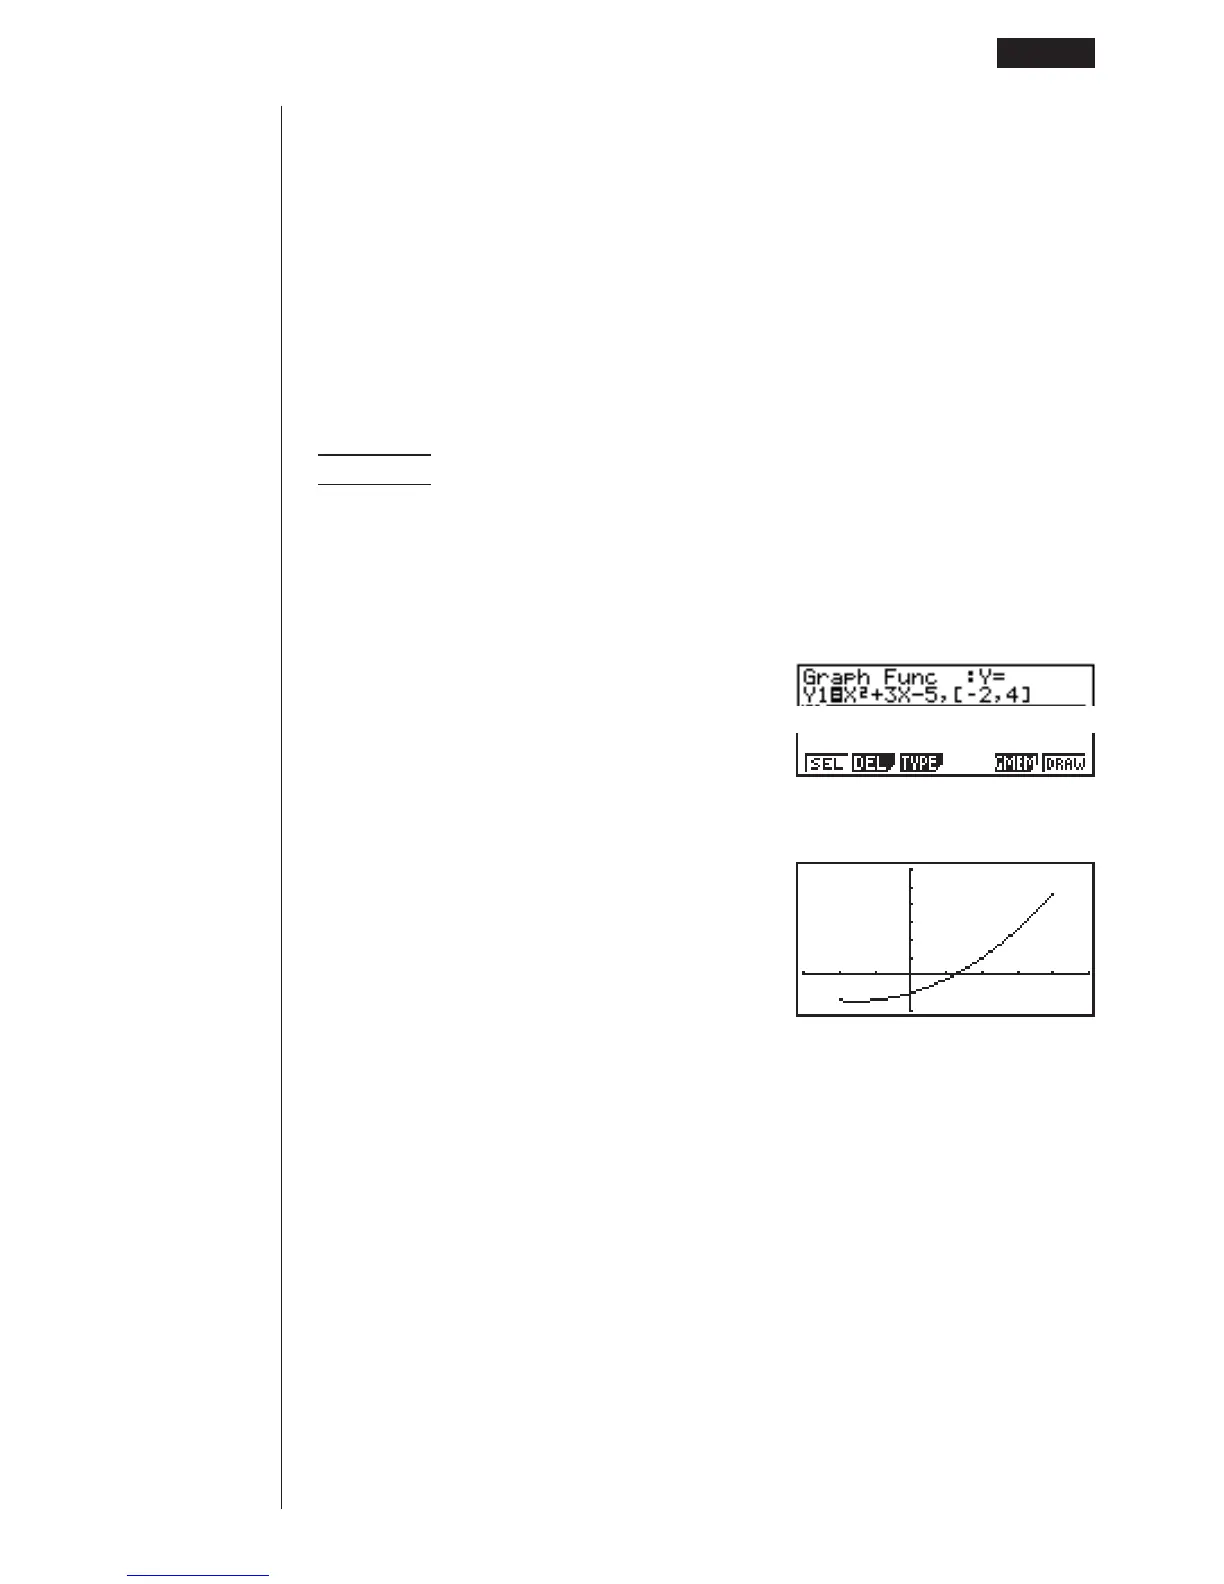
k Graphing in a Specific Range
You can use the following syntax when inputting a graph to specify a start point and
end point.
<function> , ! [ <start point> , <end point> ! ] w
Example To graph y = x
2
+ 3x – 5 within the range of –2
<<
<<
< x
<<
<<
< 4
Use the following View Window parameters.
Xmin = –3 Ymin = –10
Xmax = 5 Ymax = 30
Xscale = 1 Yscale = 5
3(TYPE)1(Y =)
(Specifies graph type.)
vx+dv-f,
![-c,e!]w
(Stores expression.)
6(DRAW) or w
(Draws graph.)
• You can specify a range for rectangular coordinate, polar coordinate, parametric,
and inequality graphs.
kk
kk
k Overwrite
Using the following syntax to input a graph causes multiple versions of the graph to
be drawn using the specified values. All versions of the graph appear on the display
at the same time.
<function with one variable> , ! [ <variable name> ! =
<value> , <value> , .... <value> ! ] w
123456
Other Graphing Functions 8 - 6