150
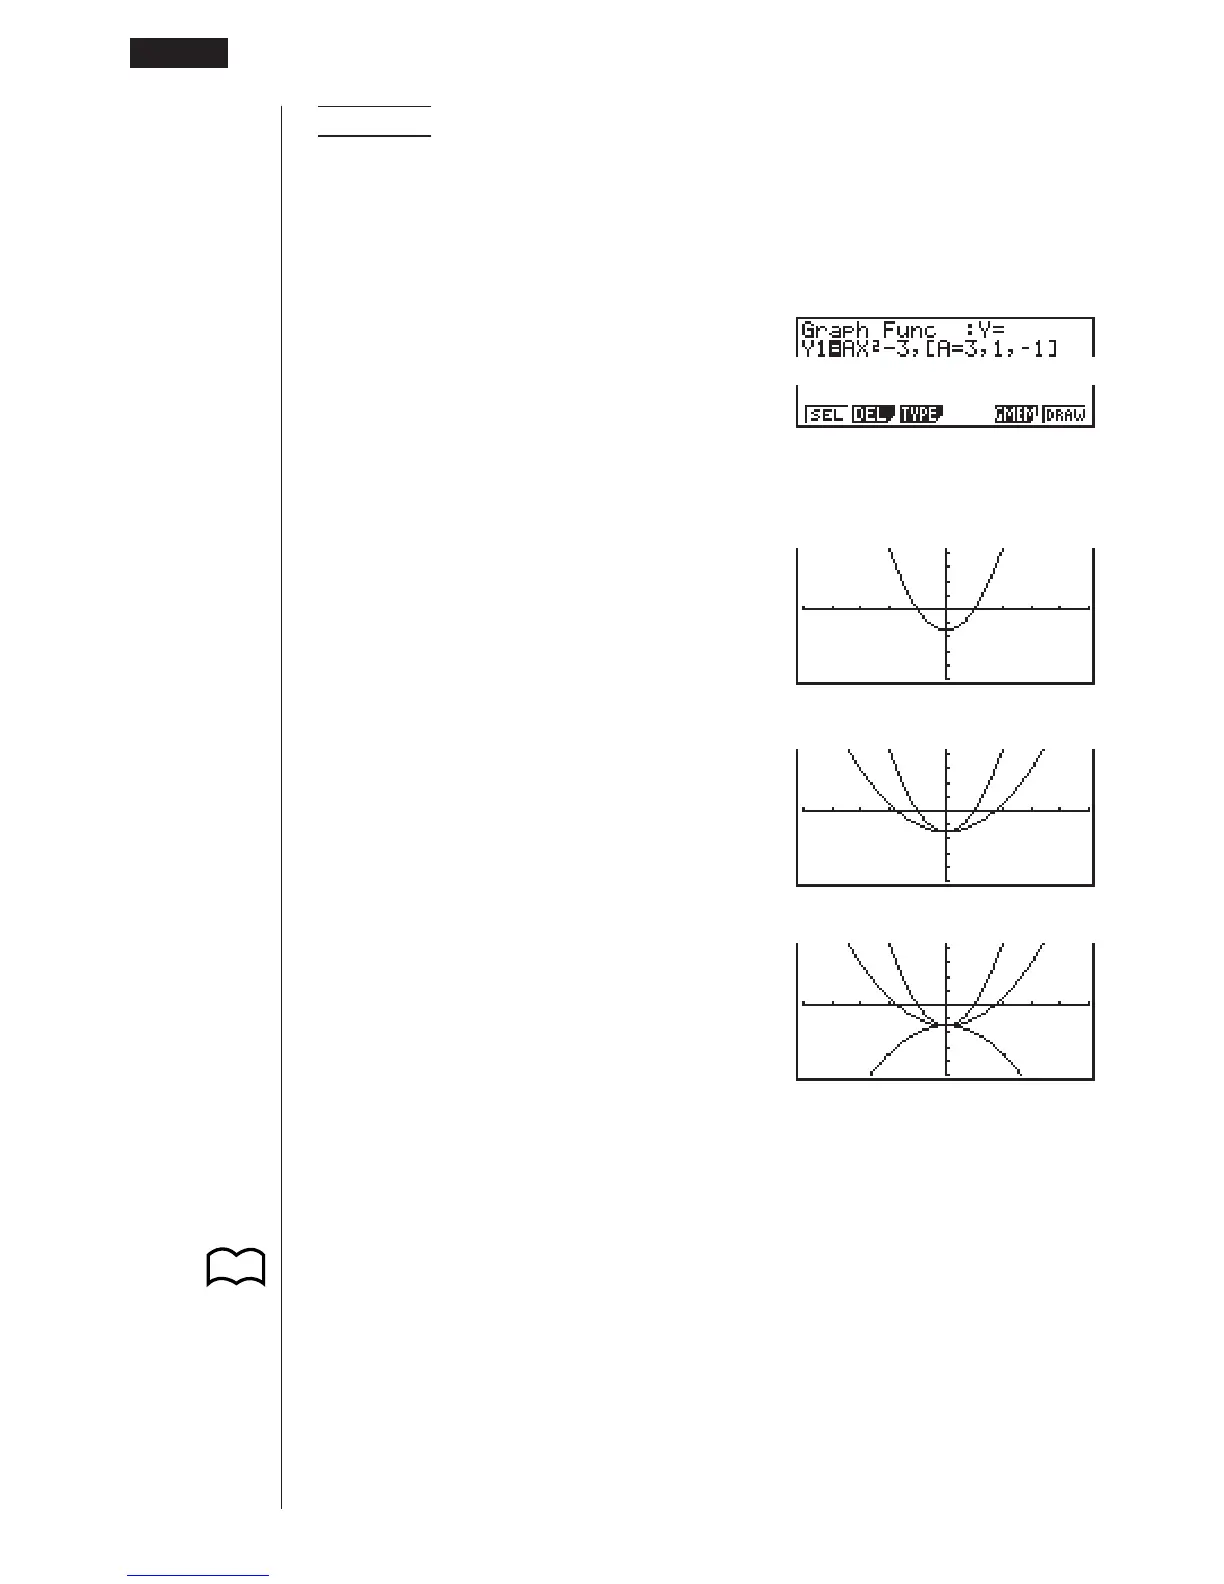
Example To graph y = Ax
2
– 3, substituting 3, 1, and –1 for the value of A
Use the following View Window parameters.
Xmin = –5 Ymin = –10
Xmax = 5 Ymax = 10
Xscale = 1 Yscale = 2
3(TYPE)1(Y =)
(Specifies graph type.)
aAvx -d,
![aA!=d,
b,-b!]w
(Stores expression.)
6(DRAW)
(Draws graph.)
(
(
• The function input using the above syntax can have only one variable.
• You cannot use X, Y, r,
"
, or T as the variable name.
• You cannot assign a variable to the variable in the function.
• When the set-up screen’s Simul Graph item is set to “On,” the graphs for all the
variables are drawn simultaneously.
• You can use overwrite with rectangular coordinate, polar coordinate, parametric,
and inequality graphs.
P.8
123456
8 - 6 Other Graphing Functions