CHK Power Quality Pty Ltd, User Manual – Miro Power Quality Logger and Analyser, 15 August 2016
Website: www.chkpowerquality.com.au; Enquiries: sales@chkpowerquality.com.au; Page 148
Address: Unit 1, 3 Tollis Place, Seven Hills, NSW 2147, Sydney, Australia; ABN: 53 169 840 831; Telephone: +61 2 8283 6945;
Fax: +61 2 8212 8105; Website: www.chkpowerquality.com.au
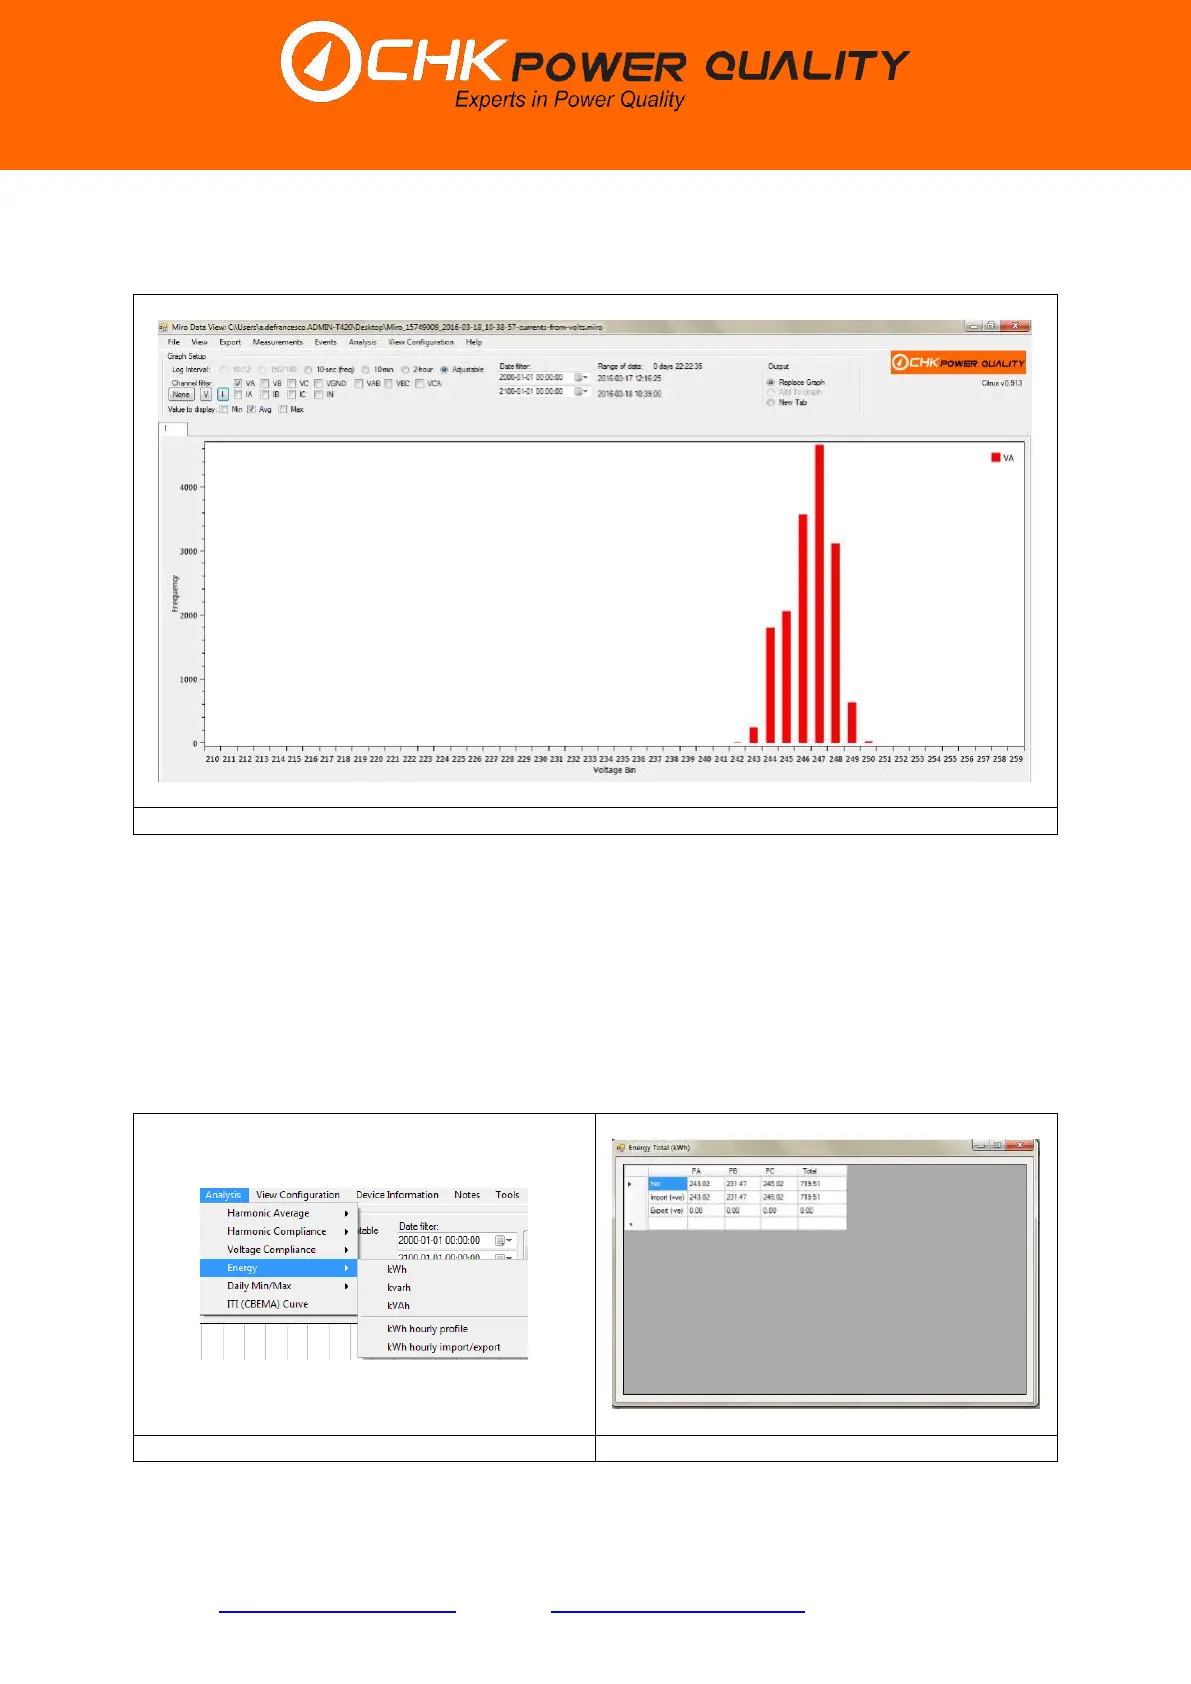
The histogram can be graphed without the compliance limits by unchecking ‘Enable
Compliance Limits’ checkbox. The corresponding histogram is shown in figure 5.9.6.3.10.
5.9.6.4 Energy
Clicking on the ’Energy’ button opens another submenu providing options to select either
‘kWh’, ‘kvarh’, ‘kVAh’, ‘kWh hourly profile’ or ‘kWh hourly import/export’ as shown in figure
5.9.6.4.1.
Click on the ’kWh’ button and a table appears as shown in figure 5.9.6.4.2 displaying the
total energy in kWh for each phase and includes the ‘Net’, ‘Import (+ve)’ and ‘Export (-ve)’
energies.
Click on the ’kvarh’ band ‘kVAh’ buttons and tables appear as shown in figures 5.9.6.4.3 and
5.9.6.4.4 displaying the ‘Net’ energy in kvarh and kVAh for each phase.

 Loading...