CHK Power Quality Pty Ltd, User Manual – Miro Power Quality Logger and Analyser, 15 August 2016
Website: www.chkpowerquality.com.au; Enquiries: sales@chkpowerquality.com.au; Page 162
Address: Unit 1, 3 Tollis Place, Seven Hills, NSW 2147, Sydney, Australia; ABN: 53 169 840 831; Telephone: +61 2 8283 6945;
Fax: +61 2 8212 8105; Website: www.chkpowerquality.com.au
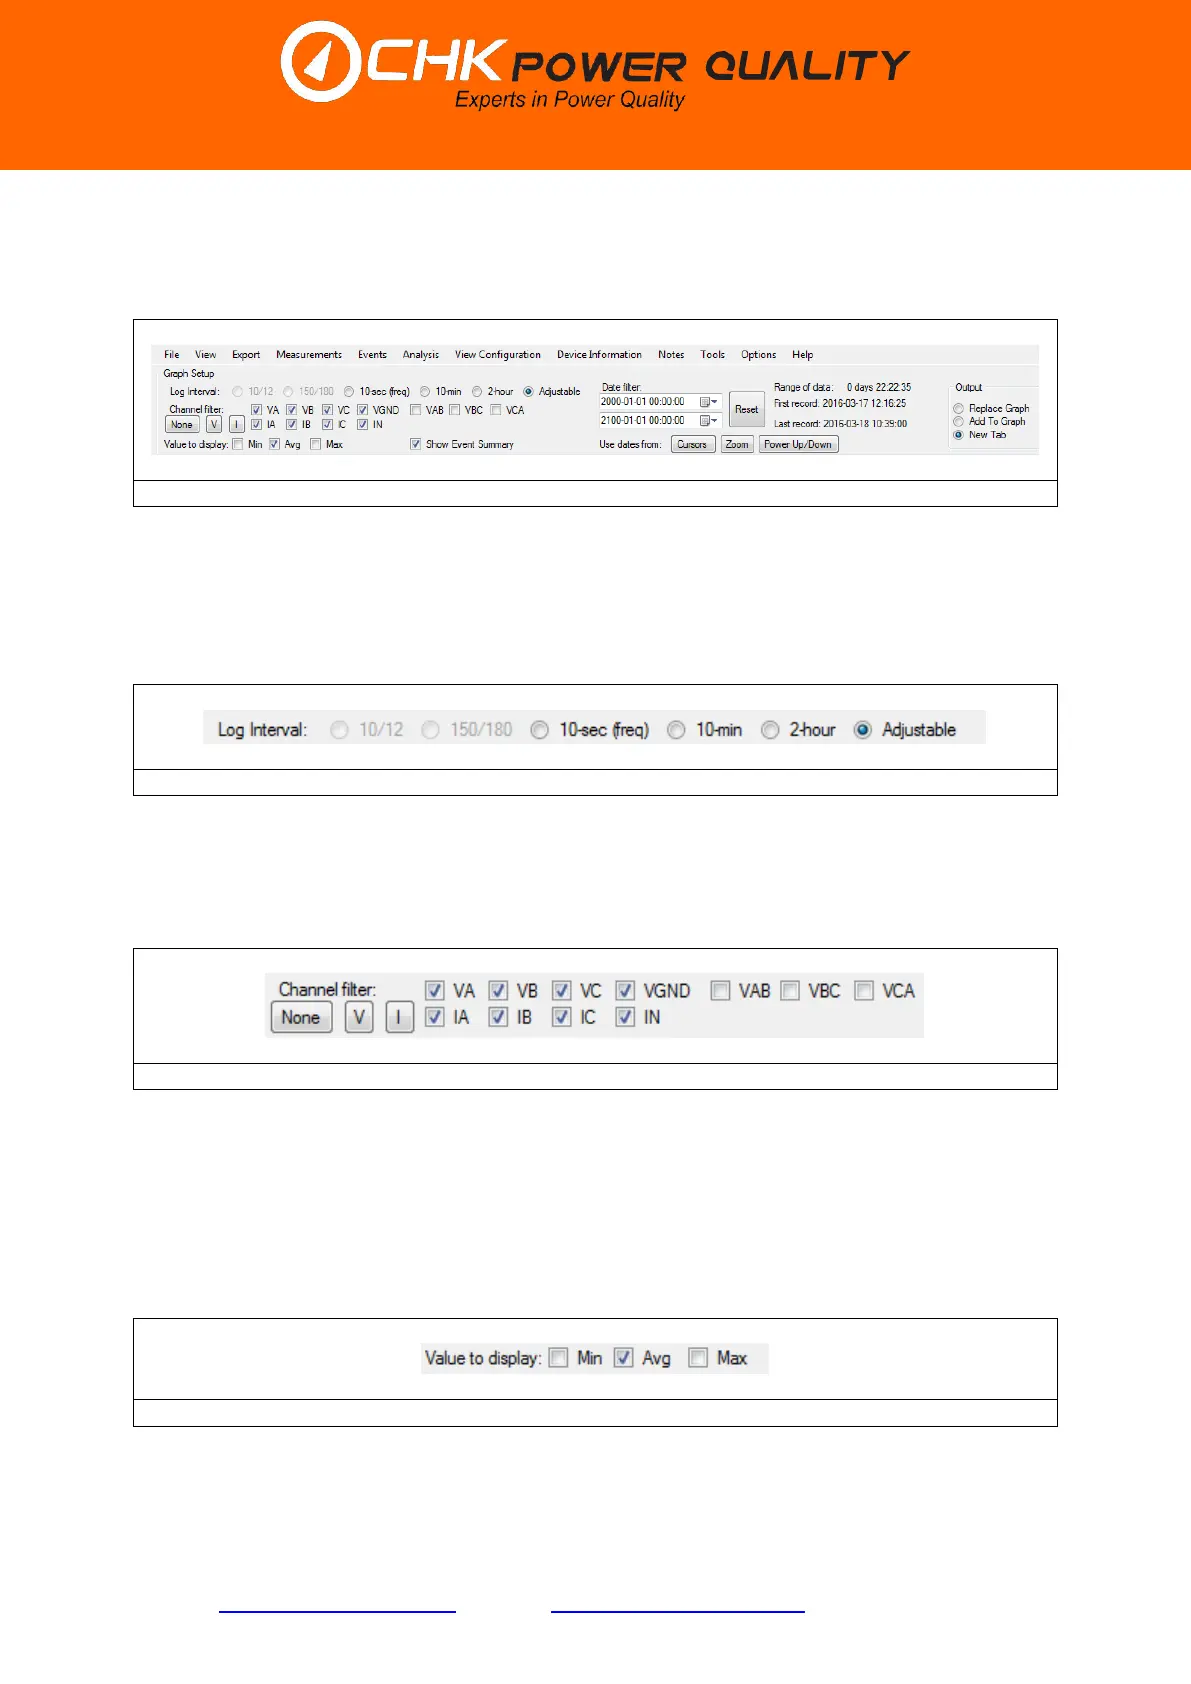
5.9.13 Graph setup
The ’Graph Setup’ menu bar shown in figure 5.9.13.1 allows the user to view a restricted
data set.
5.9.13.1 Log intervals
The user can display data at any of the six log intervals, provided it has been logged at the
desired log intervals; if not then the log interval will be disabled. The example below in figure
5.9.13.1.1 shows that ‘10/12’, ‘150/180’ as disabled.
5.9.13.2 Channel filter
The user can view any combination of voltage and current channels as shown in figure
5.9.13.2.1.
The user can quickly disable all channels by clicking the ‘None’ button. The user can quickly
enable and disable all voltage and current channels by repeatedly clicking on the ‘V’ and ‘I’
buttons.
5.9.13.3 Display values
Graphs can display any values (minimum, average and maximum) shown in figure 5.9.9.3.1.
5.9.13.4 Date filter
 Loading...