CHK Power Quality Pty Ltd, User Manual – Miro Power Quality Logger and Analyser, 15 August 2016
Website: www.chkpowerquality.com.au; Enquiries: sales@chkpowerquality.com.au; Page 168
Address: Unit 1, 3 Tollis Place, Seven Hills, NSW 2147, Sydney, Australia; ABN: 53 169 840 831; Telephone: +61 2 8283 6945;
Fax: +61 2 8212 8105; Website: www.chkpowerquality.com.au
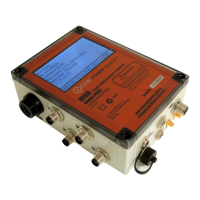
Select the desired power up event as shown in figure 5.9.13.4.12. The start date-time is now
updated as shown in figure 5.9.13.4.13.
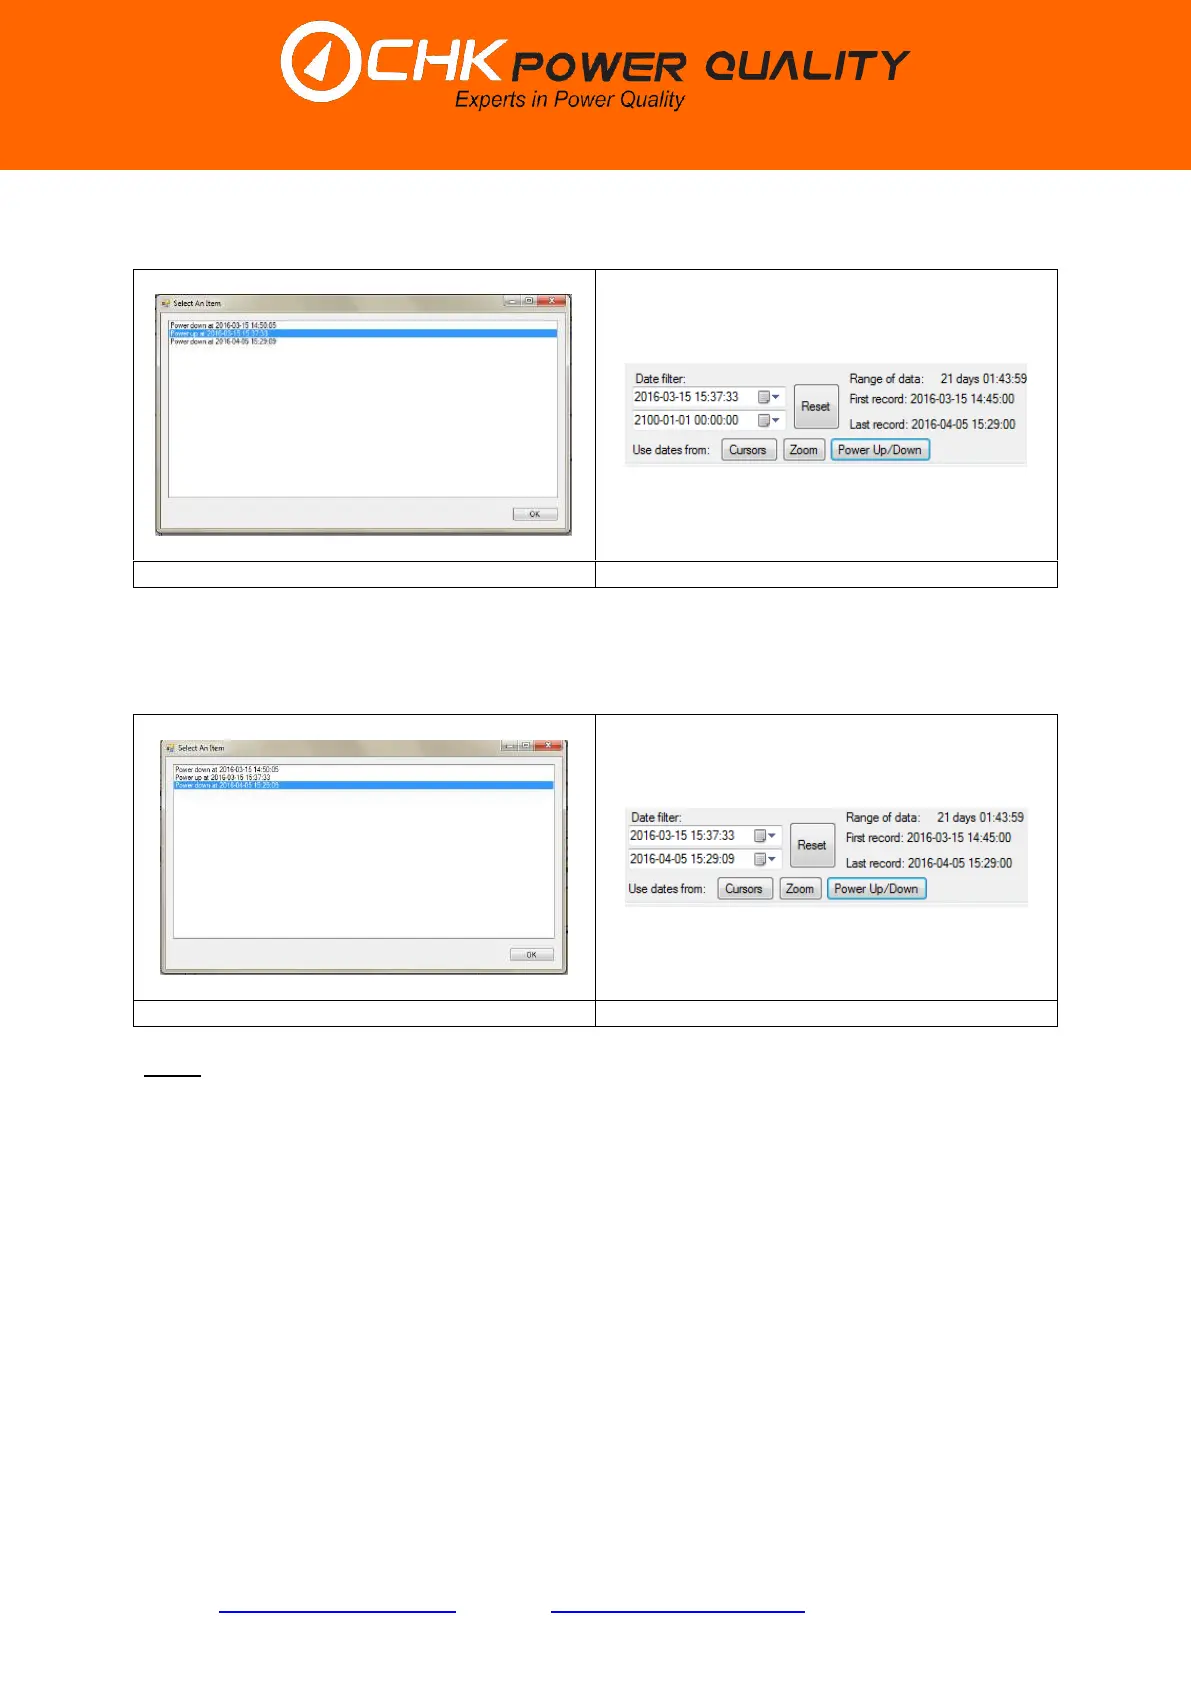
Again, click on the ‘Power Up/Down’ button to generate a list box showing all the power up
and power down events. Select the desired power down event as shown in figure
5.9.13.4.14. The finish date-time is now updated as shown in figure 5.9.13.4.15.
Reset
The user can set the date-times back to the default settings by clicking on the ‘Reset’ button.
5.9.13.5 Graphical output
The user has various options, shown in figure 5.9.13.5.1, as to how to update measurement
views.
‘Replace Graph’: updates the current graph with new measurement data;
‘Add To graph’: appends new measurement data on existing graph with previous
measurement data; and
‘New Tab’: New measurement data on a new graph on a new tab.
 Loading...