CHK Power Quality Pty Ltd, User Manual – Miro Power Quality Logger and Analyser, 15 August 2016
Website: www.chkpowerquality.com.au; Enquiries: sales@chkpowerquality.com.au; Page 151
Address: Unit 1, 3 Tollis Place, Seven Hills, NSW 2147, Sydney, Australia; ABN: 53 169 840 831; Telephone: +61 2 8283 6945;
Fax: +61 2 8212 8105; Website: www.chkpowerquality.com.au
5.9.6.6 ITI (CBEMA) curve
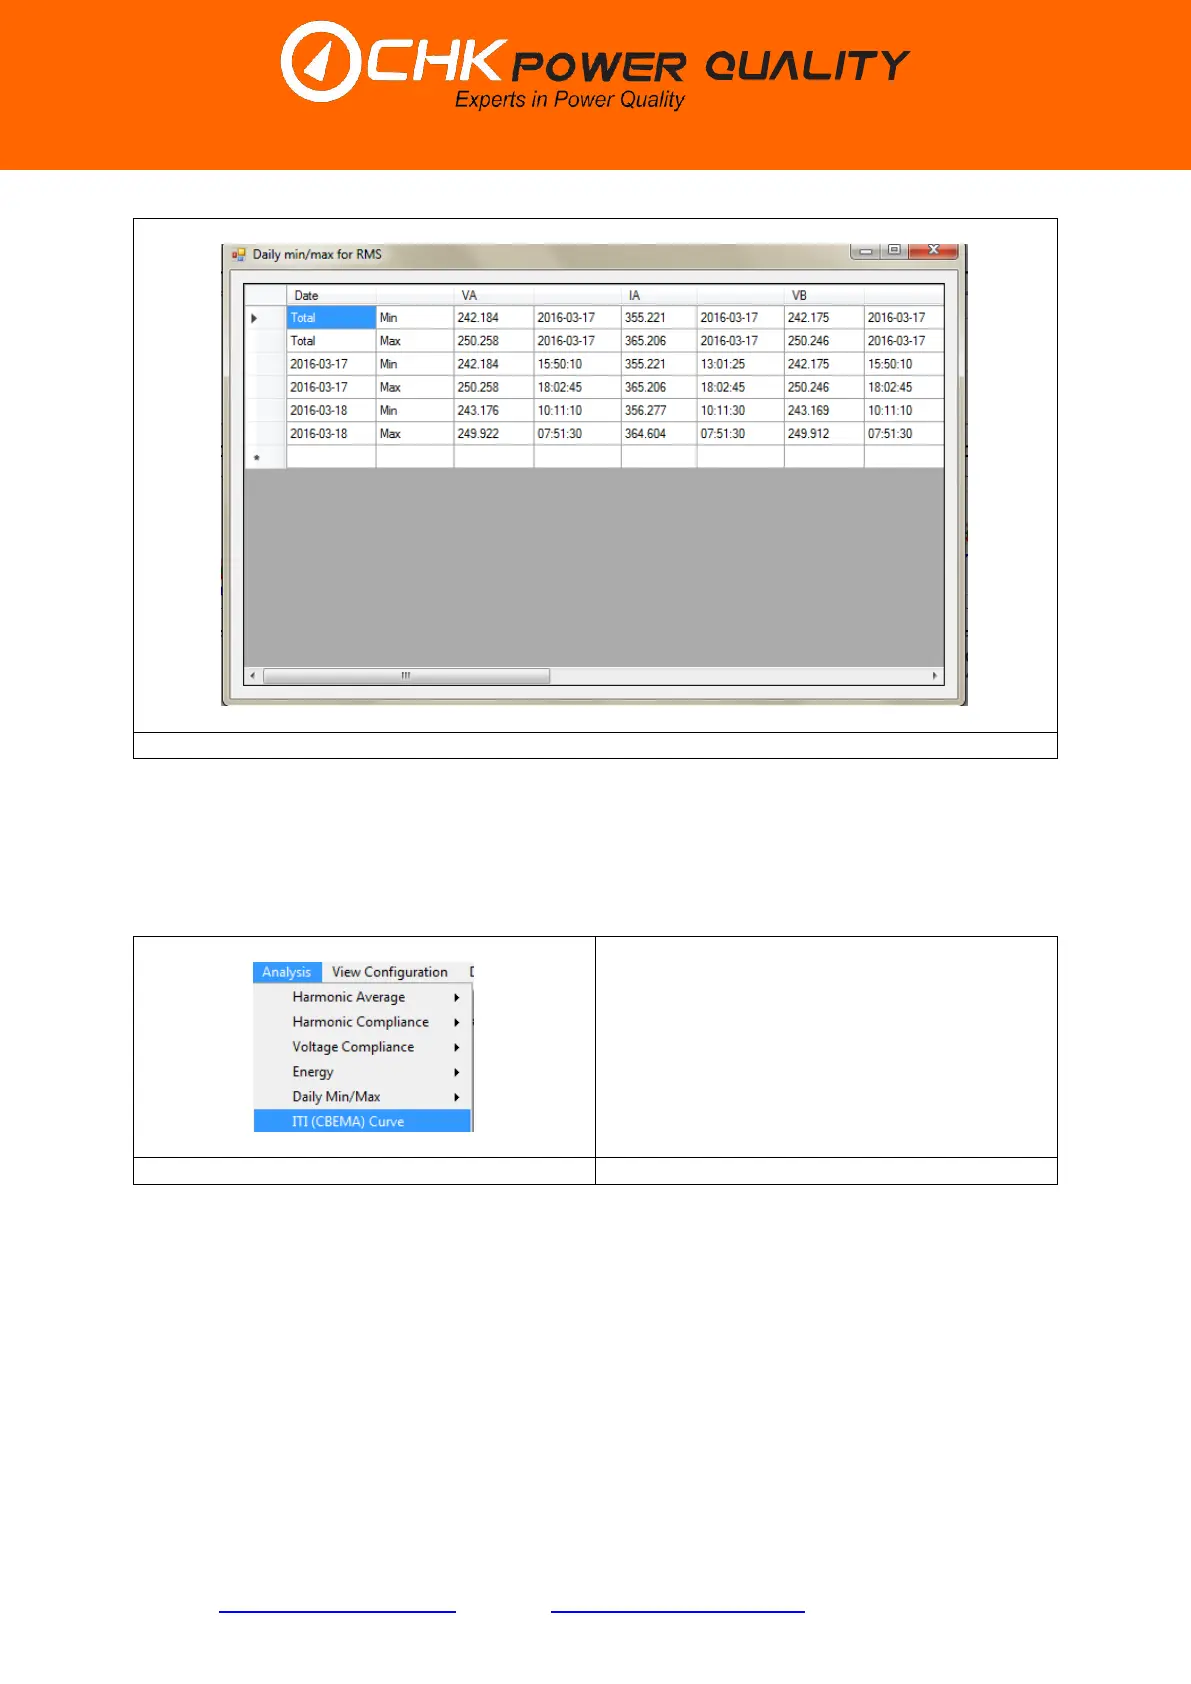
Clicking on the ’ITI (CBEMA) Curve’ button shown in figure 5.9.6.6.1 generates a graph as
shown in figure 5.9.6.6.2. The graph plots dips and swells. In this case nothing is plotted as
no dips or swells are recorded. Figure 5.9.6.6.3 shows a graph with dip and swell events.

 Loading...