CHK Power Quality Pty Ltd, User Manual – Miro Power Quality Logger and Analyser, 15 August 2016
Website: www.chkpowerquality.com.au; Enquiries: sales@chkpowerquality.com.au; Page 26
Address: Unit 1, 3 Tollis Place, Seven Hills, NSW 2147, Sydney, Australia; ABN: 53 169 840 831; Telephone: +61 2 8283 6945;
Fax: +61 2 8212 8105; Website: www.chkpowerquality.com.au
an ‘F-3000’ sensor (flexible current sensor rated at 3000A) and ‘C-100’ sensor (100A clamp
on CT) connected. The ‘CT Types’ will display ‘NONE’ if no sensor is connected or if the
sensor is not identified by the Miro.
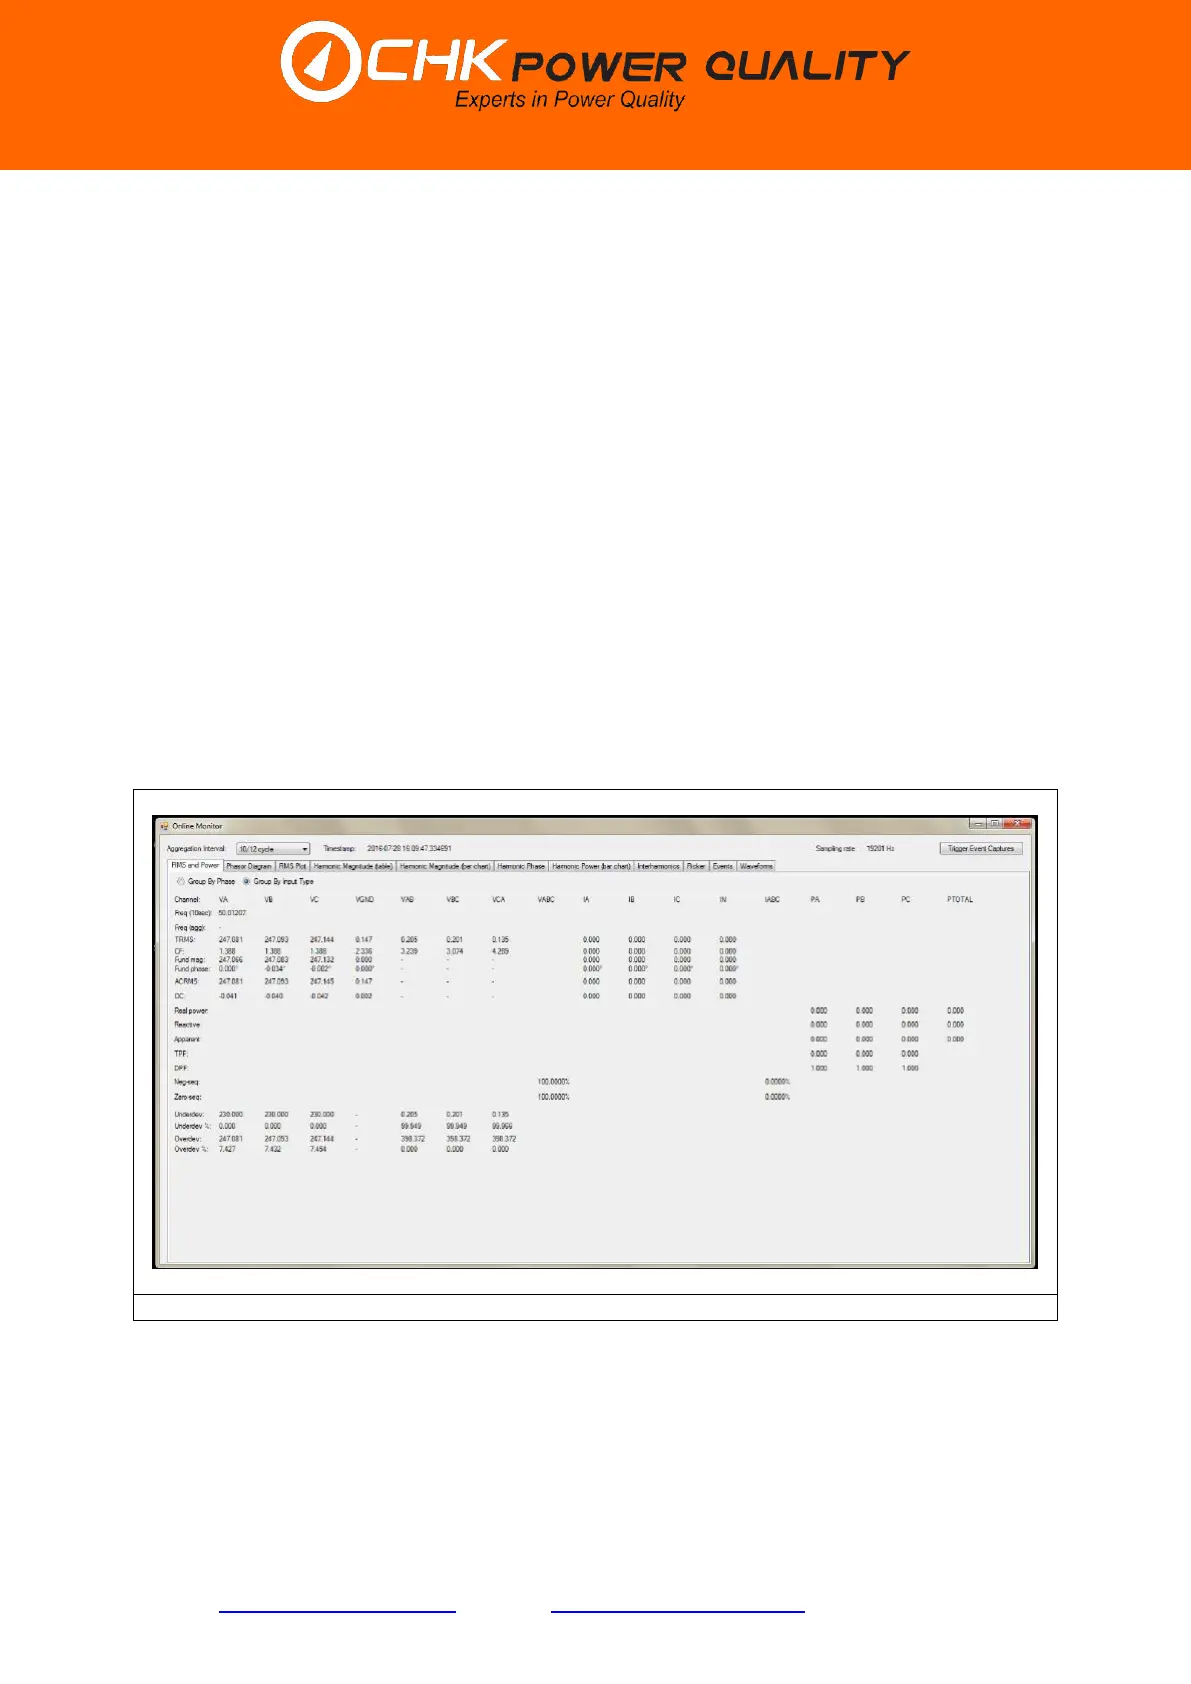
5.3 Online monitor
The ‘Online Monitor’ tool allows the user to view measurements in quasi real-time without
the need for logging.
Step 1: Click on the ‘Online Monitor’ button on the ‘Miro Operations’ window. The ‘Online
Monitor’ form appears and provides menu tabs for the various monitoring screens as shown
in figure 5.3.1. There are currently ten menu tabs and these include:
RMS and Power;
RMS Plot;
Harmonic Magnitude (table);
Harmonic Magnitude (bar chart);
Harmonic Phase;
Harmonic Power (bar chart);
Interharmonics;
Flicker;
Events; and
Waveforms.
.
Items shown above the tabs include: Aggregation Interval; Timestamp; Sampling rate; and
the Trigger Event Captures button. These items are visible for all tabs except for Flicker,
Events and Waveforms.
5.3.1 Aggregation interval
 Loading...