75
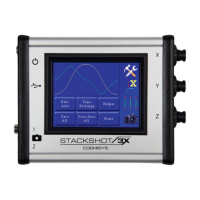
Using the same examples used previously, if we press the “Edit Axis” button we will see this
screen:
Here we only see the motion profile for a single axis. The button shows that we are
currently looking at the X-axis. If you press the button you can cycle through all three.
In the plot window you see the yellow line (which is the motor position vs. time) and the green
line (velocity/speed – see section “7.5 – Velocity Curve“). You’ll also see a vertical red line that
has “0s 0.00 deg” next to it. That is the time and position for the current key frame. In this
example we only have two key frames – which is plenty to define a nice smooth motion profile.
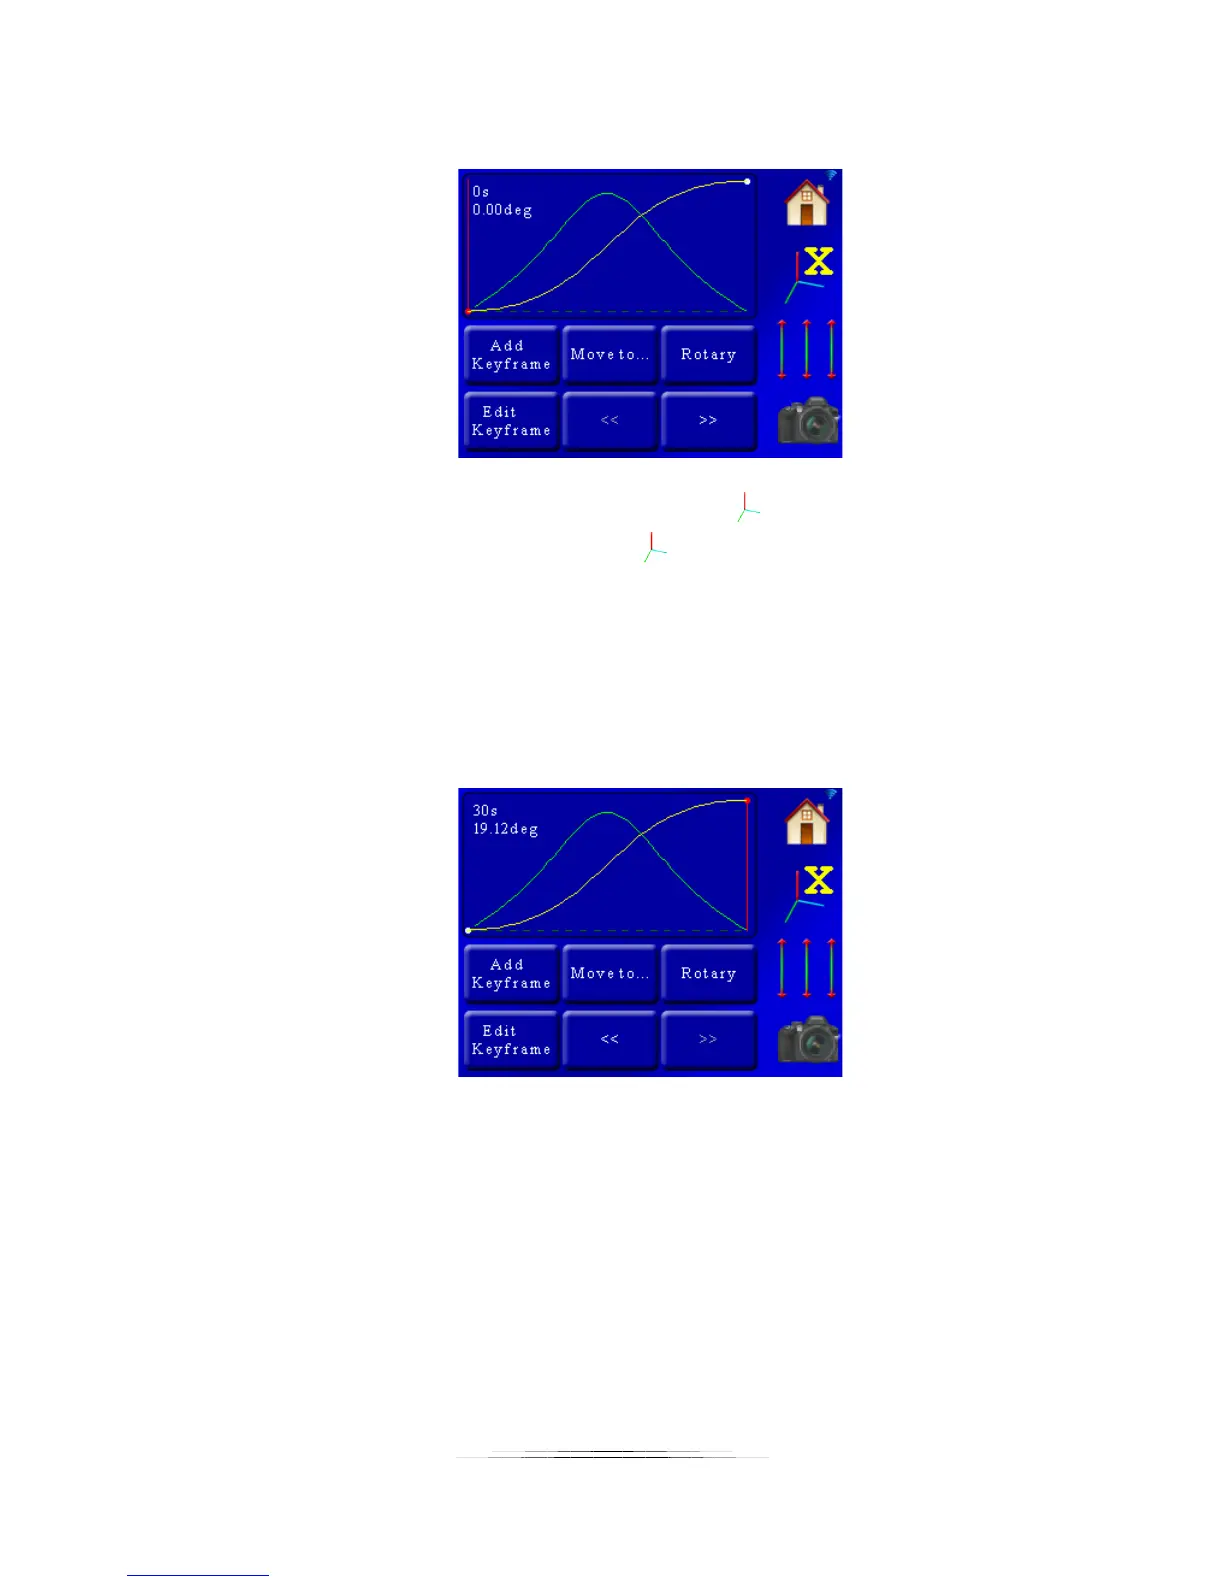
To move from one key frame to the other press the “<<” or “>>” buttons. Let’s take a look at
what is on the screen when we go to the final key frame:
Since we’re in “Video: Continuous” mode, the time units are in seconds (you would see frames
instead of seconds for “Shoot-Move-Shoot” mode). As you can see the screen shows that at 30
seconds the X-axis will have moved a positive 19.12 degrees.
7.11.1 Rotary / Rail / Slider
This button changes what is connected to this axis. In the above example you can see that a
rotary table is connected. Pressing this button cycles through the different types of gear that