69
If everything looks good then you can press the “Okay” button.
From this point the process is exactly the same as section “7.3.1 - Video: Continuous”. You will
be prompted for the profile type, what is connected, and the start/end positions.
7.4 Changing Axes
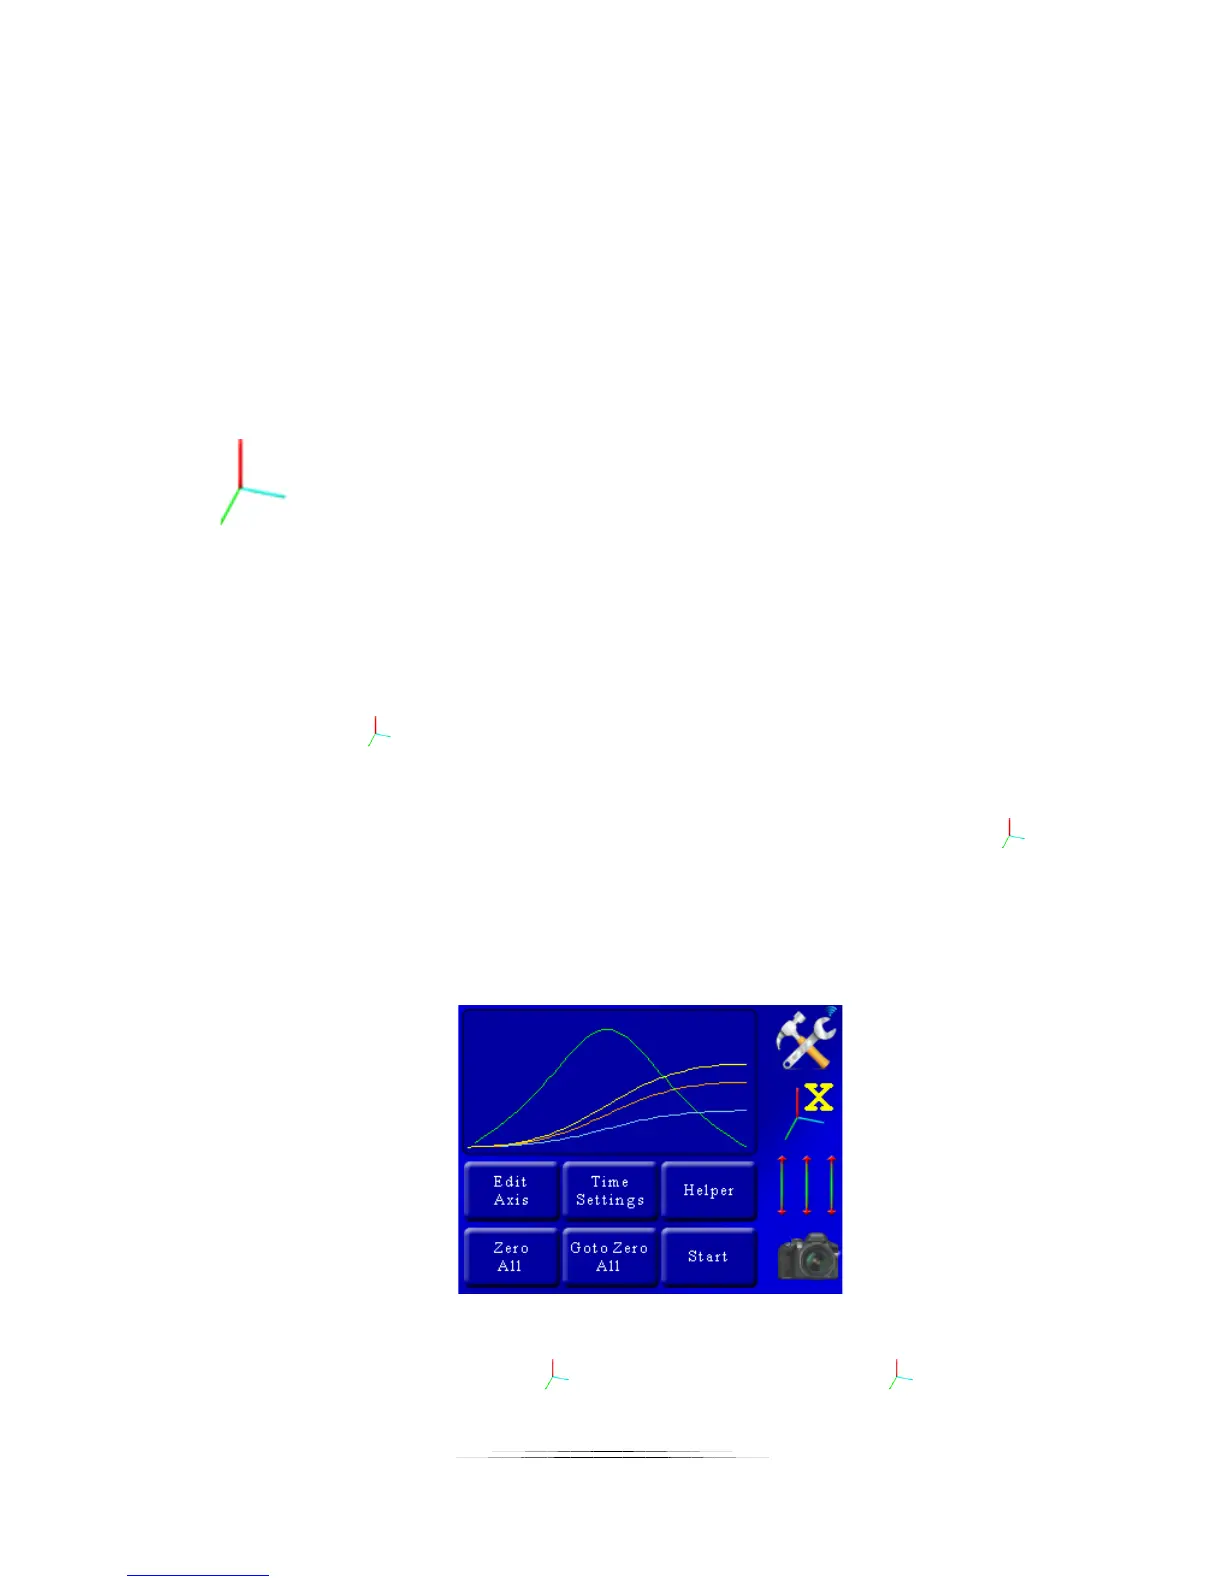
In the above screen you can see all three axes motion profile. They are color-coded. Below the
settings tab you see the three-axis indicator:
With a colored “X” next to it. The color of the “X” corresponds to the colored line on the curve.
The color-coding is as follows:
Yellow: X-axis
Orange: Y-Axis
Blue: Z-axis
If you press the button, it will cycle through all three axes and change the color of the axis
indicator.
If you want to disable an axis from running you can do that by pressing and holding the
button. It will gray out just that axis and it won’t run when you press the “Start” button.
7.5 Velocity Curve
You’ll notice a green curve in the plot window:
This is the “Velocity” curve, or speed curve for that axis. In the above example the green curve
is the speed for the X-axis, since the button shows “X”. If you press the button, the green
curve will change and reflect the velocity for the next axis. You’ll see that the bottom of the