SEVEN PLUS User’s Guide | 119
Number of Readings Provided
The SEVEN PLUS is capable of providing a reading up to every 5 minutes, or up to 288 readings per
day. For a variety of reasons, this does not always happen. Sometimes sensors cannot provide readings
after calibration and readings are “skipped” (see Chapter 5). Table 11, below, estimates the number of
readings you can expect to receive from the SEVEN PLUS over the entire 7-day period. For example, 87%
of SEVEN PLUS devices provided between 1,557 and 1,992 readings (or at least 76% of the expected
number of readings).
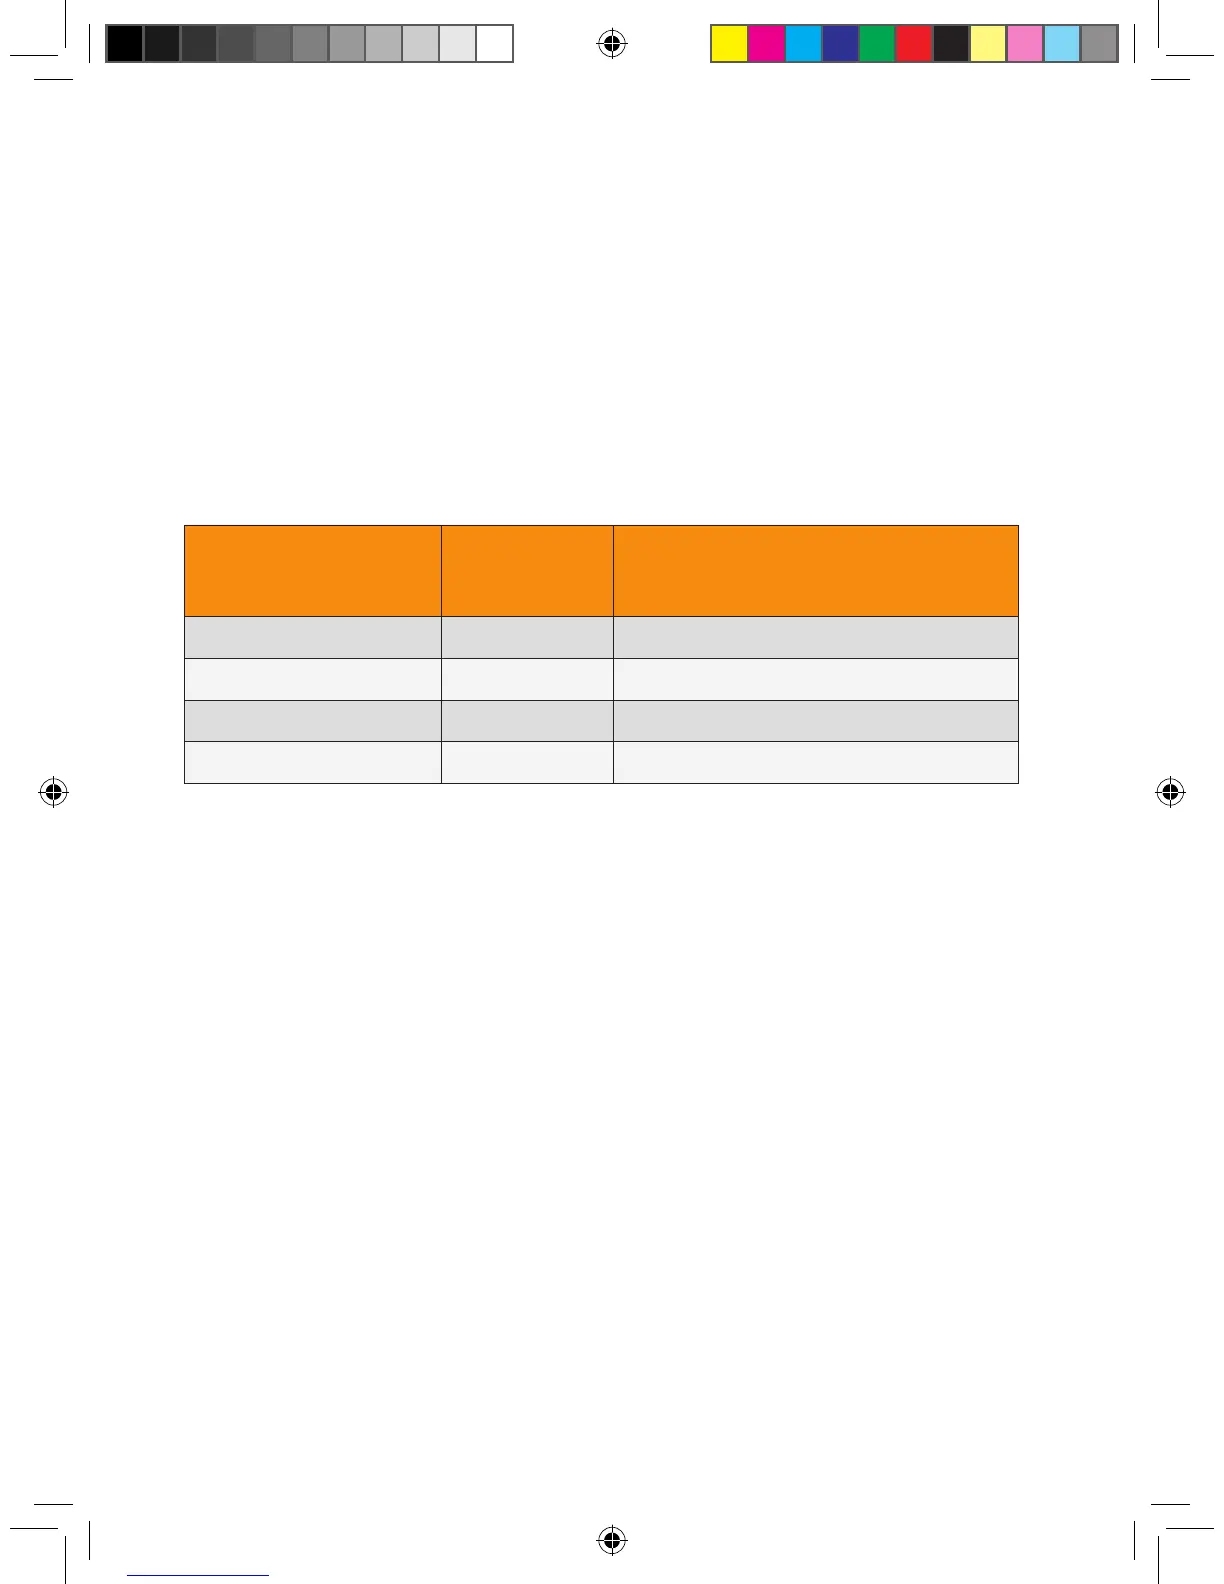
Table 11. Number of Readings Provided by Each Sensor Over 7-Days
% of Total Possible
Readings Provided
Total Readings
Provided
% of SEVEN PLUS Devices Providing
that number of readings
0-25% 261
1%
26-50% 521-782
7%
51-75% 1005-1477
4%
76-100% 1557-1992
87%
Approximately 7% of readings were lost because the Transmitter and Receiver were not communicating.
Approximately 1% of the time the SEVEN PLUS required additional calibration readings to start displaying
glucose readings again. Over 7 days of use, on average, subjects experienced 3 periods of time where the
Receiver could not display glucose readings and displayed “???” instead. These periods lasted on average
for 1 hour. A small percentage of subjects (<10%) experienced a period of missing glucose readings (or
“???”) for more than 4 hours. However, per the Sensor Life data above, 89% of the Sensors were able to
“recover” from these periods of signal problems and begin displaying continuous glucose readings again.
Time-Elapsed Plots
Examples of SEVEN PLUS Continuous Glucose Monitoring System overlaid with the corresponding YSI
readings over time are presented on the next page. The horizontal axis represents time, with the matching
SEVEN PLUS and YSI readings plotted above the point in time when the measurements were taken. The
circles (•) on the graph represent the SEVEN PLUS data. The “Y” represents the YSI reading.
There are three Figures presented. Figure 2 is an example of when the SEVEN PLUS performed well,
Figure 3 represents a period when the SEVEN PLUS performed in an average manner, and Figure 4
represents when the SEVEN PLUS performed poorly.