70 | SEVEN PLUS Continuous Glucose Monitoring System
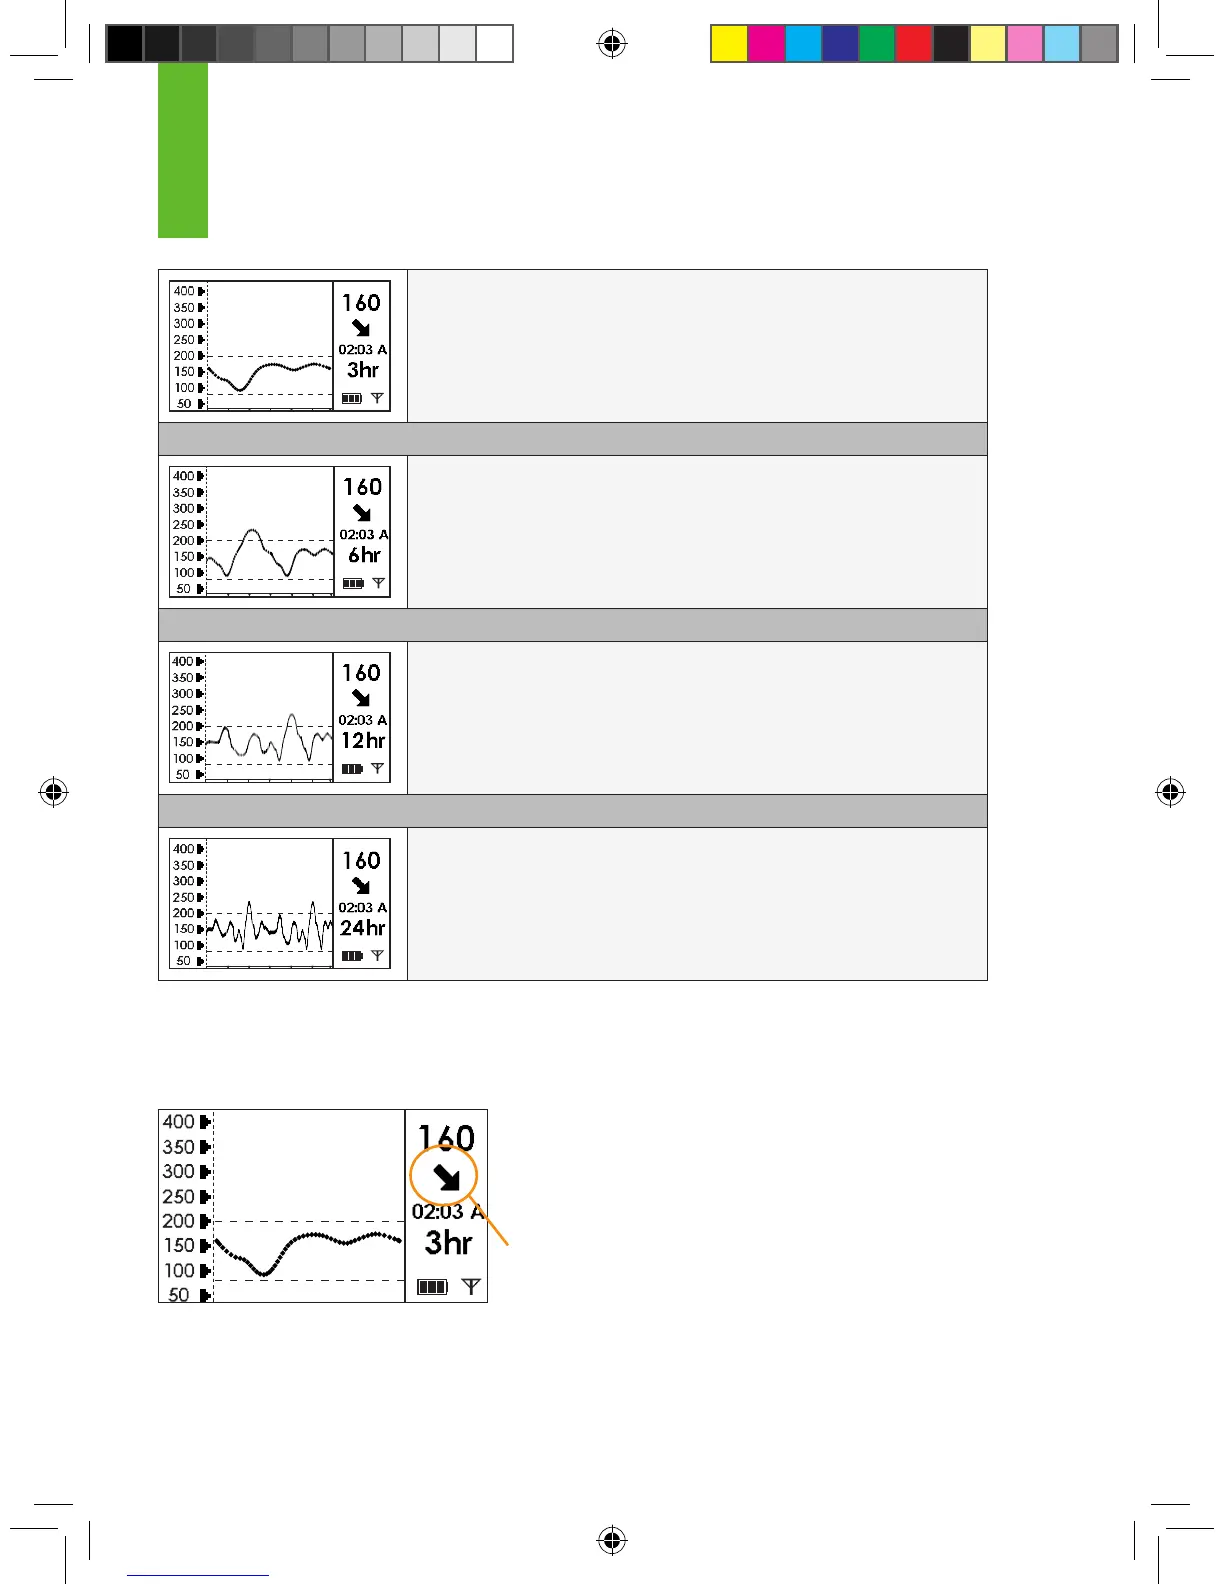
3-Hour Glucose Trend Graph: The 3-hour Trend Graph
(3 hr) shows your current glucose reading and the last 3 hours of
glucose readings (this is your default trend screen).
(Scroll down from the 3-Hour Graph to reach the 6-Hour Graph)
6-Hour Glucose Trend Graph: The 6-hour Trend Graph
(6 hr) shows your current glucose reading and the last 6 hours of
glucose readings.
(Scroll down from the 6-Hour Graph to reach the 12-Hour Graph)
12-Hour Glucose Trend Graph: The 12-hour Trend Graph
(12 hr) shows your current glucose reading and the last 12 hours
of glucose readings.
(Scroll down from the 12-Hour Graph to reach the 24-Hour Graph)
24-Hour Glucose Trend Graph: The 24-hour Trend
Graph (24 hr) shows your current glucose reading and the last
24 hours of glucose readings.
5.2 GLUCOSE TRENDS
In addition to your current glucose reading and Trend Graphs, Trend Arrows may appear to show you
how your glucose readings are changing.
The Trend Arrows appear on the upper right corner of the Trend Graphs, just below your current
glucose reading in the Status Box.
5
Trend arrows appear here