SEVEN PLUS User’s Guide | 69
•
The SEVEN PLUS reports glucose readings from 40-400 mg/dL and updates glucose read-
ings every 5 minutes.
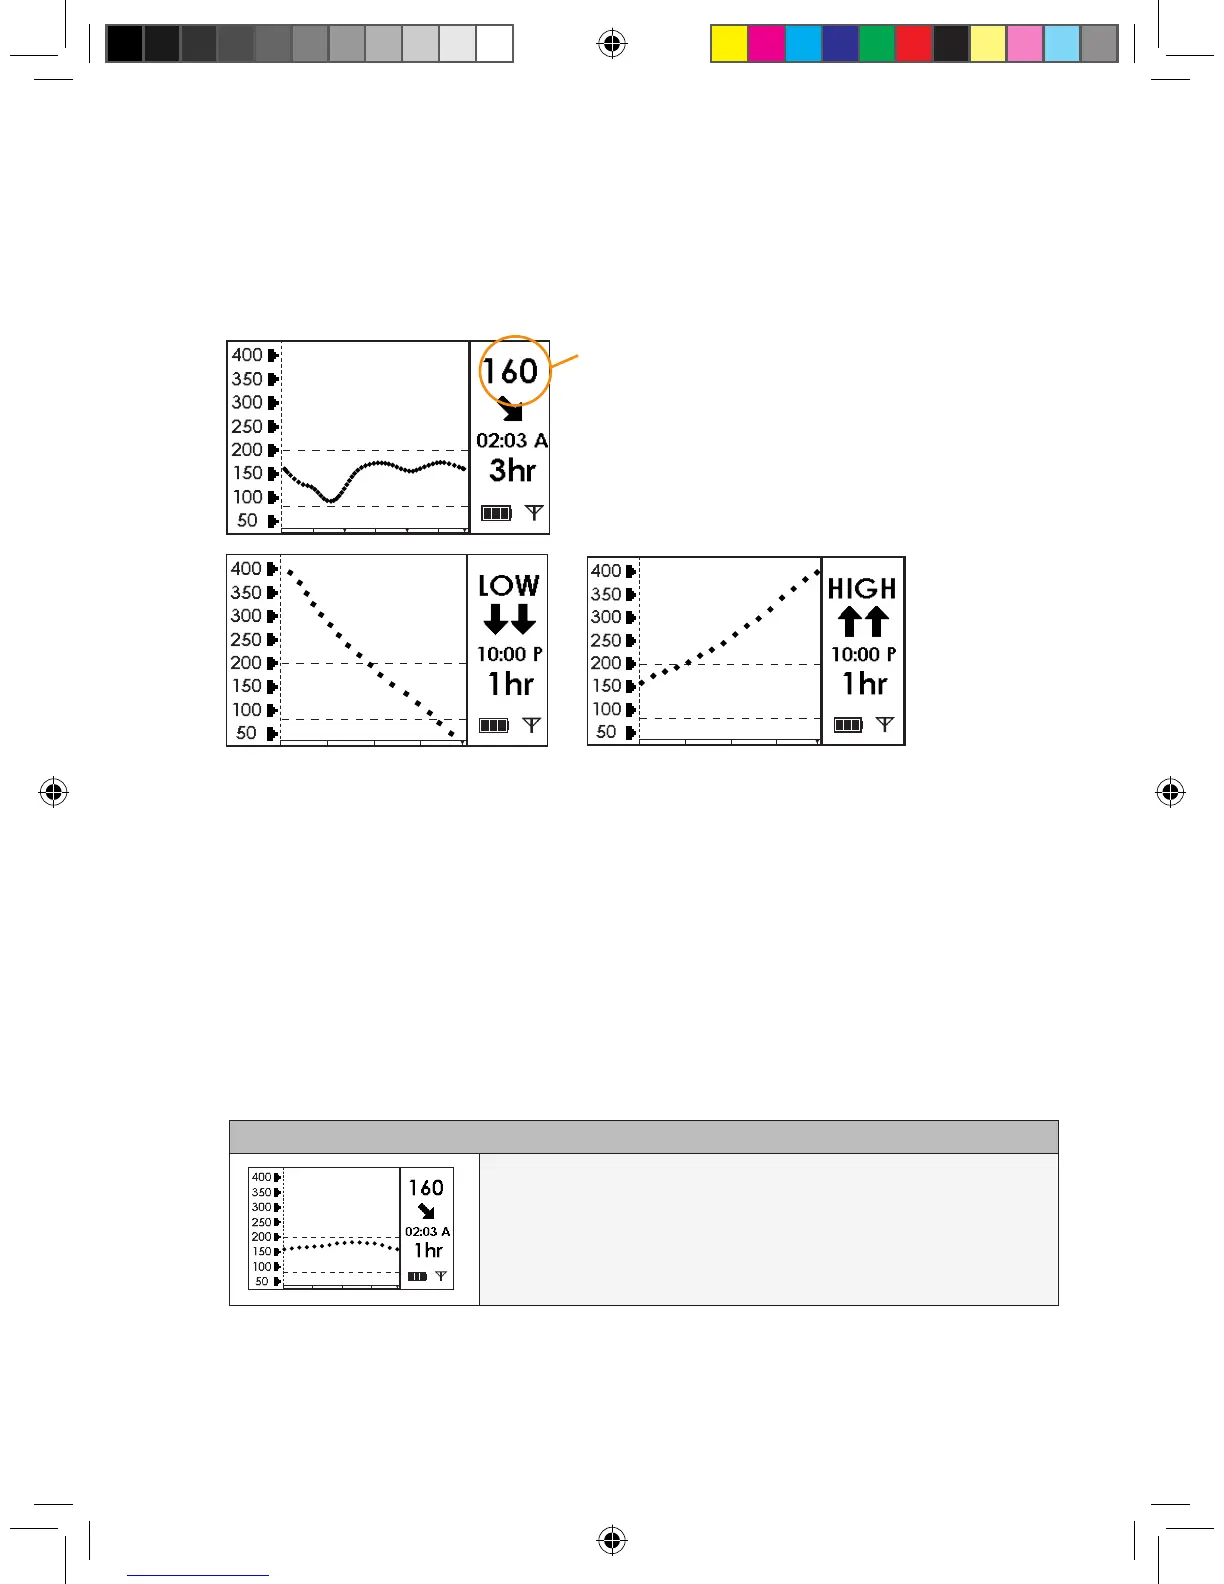
The System reads “LOW” when the glucose reading
is less than 40 mg/dL, and “HIGH” when the glucose
reading is greater than
400 mg/dL.
•
Each “dot” on the glucose Trend Graph is a glucose reading.
•
Each Glucose Trend Graph shows the current time (“A” is AM and “P” is PM).
•
The “dashed lines” on the Glucose Trend Graphs are the High Alert and Low Alert Settings (see
Chapter 2, Section 2.3, “Setting your Alerts,” to change
these settings).
You can see Trend Graphs of your glucose information from the past 1-hour, 3-hour, 6-hour, 12-
hour, and 24-hour periods by pressing the Up p and Down q Arrows on your Receiver. These
Glucose Trend Graphs show you where your glucose levels have been and where your glucose
levels are headed.
(Scroll up from the 3-Hour Graph to reach the 1-Hour Graph)
1-Hour Glucose Trend Graph: The 1-hour Trend Graph
(1 hr) shows your current glucose reading and the last 1 hour of
glucose readings.
“Low”- Less than 40 mg/dL “High”-Greater than 400 mg/dL
The glucose reading is in milligrams per deciliter
(mg/dL) units.
(continued on next page)