Running A UST Test
3-12 72A-1230 Rev. F
July 22, 2005
3. Click the icon. In the pop-up window, select whether you want a
Histogram or a Trend.
4. If a Histogram is chosen, select the value you wish to plot. In Bins, select
the number of ranges you wish to use to categorize your data, then click
Draw.
5. If a Trend is chosen, select values to plot on the X and Y axes, then click
Draw.
6. After you have drawn the graph, there are several icons along the top you
can select to change the type of graph, or to refine it’s appearance.
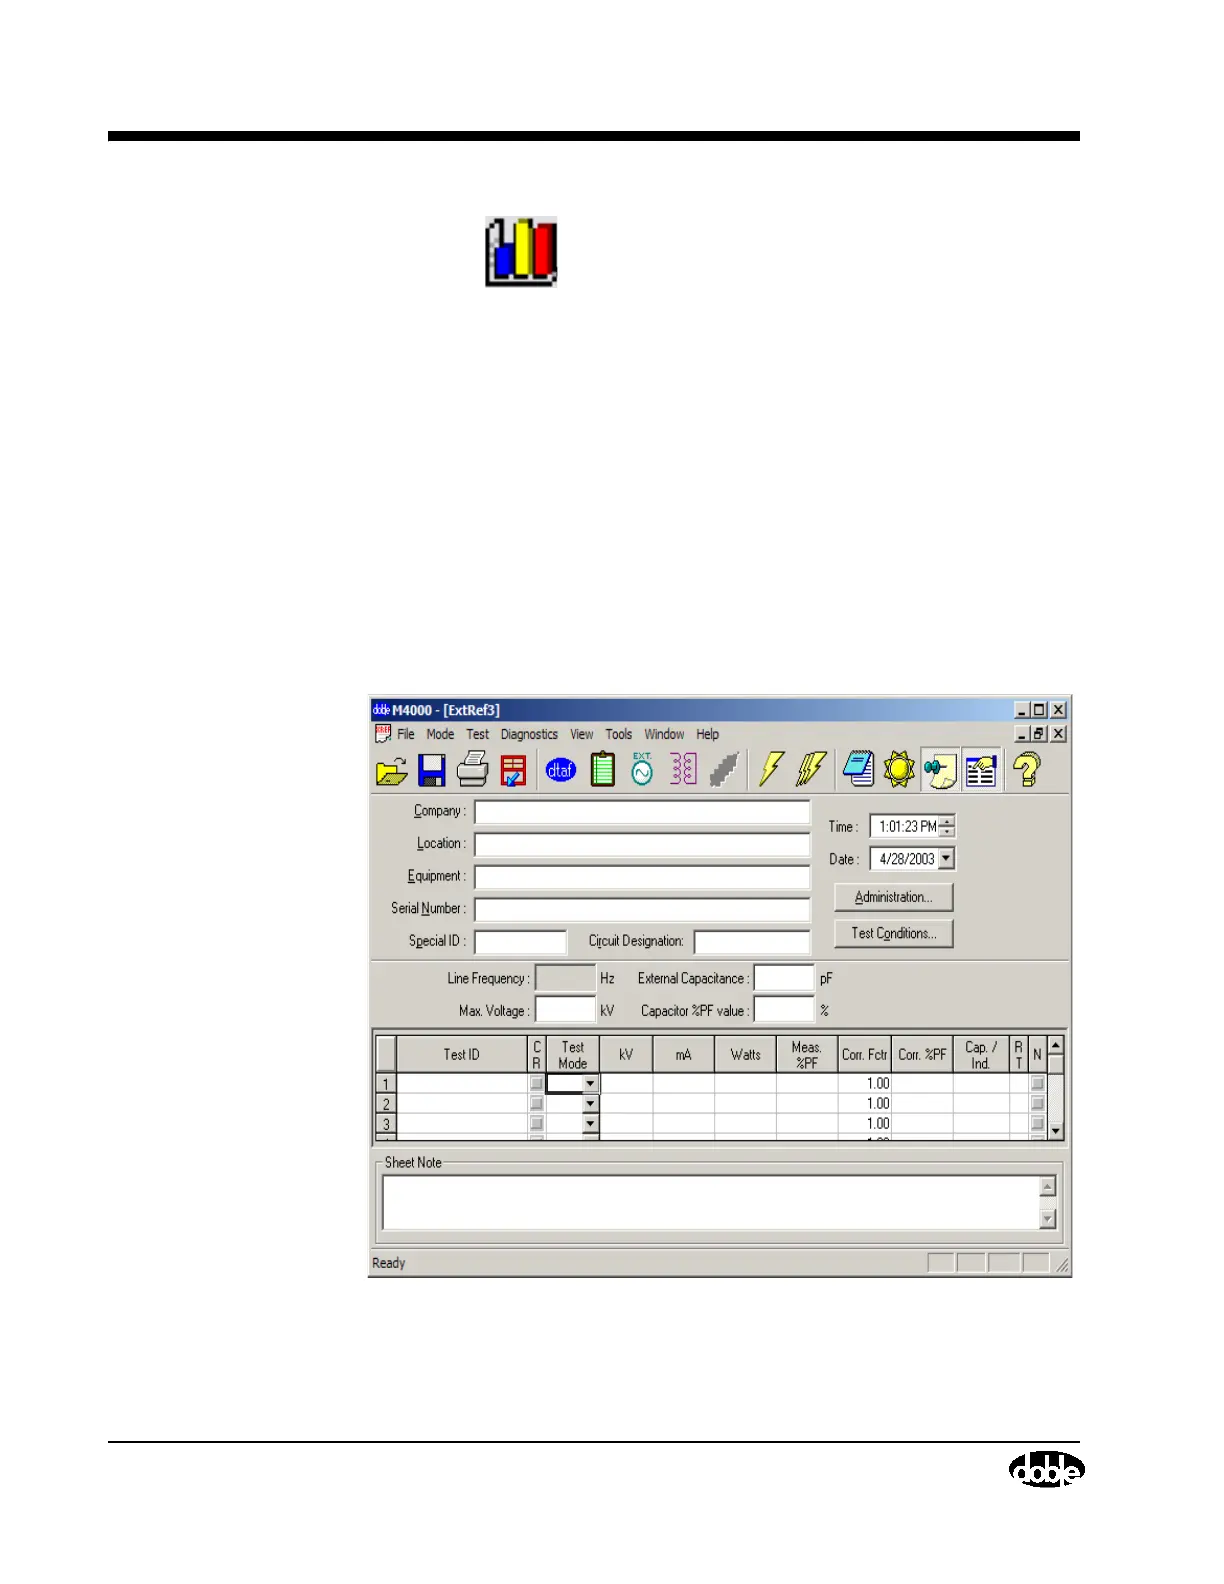
External Reference/Source Test (Optional Software)
Running A UST Test
Figure 3.9 External Reference Main Screen