WinAQMS Mini DAS User manual 1.0 Edit Menu
47
The All option shows the data for all reports in the database for the selected time
period.
The Find button will use the values in the Start Date/Time, End Date/Time and
Report Name fields to load the data into the grid in the centre of the window.
At the bottom of the window are nine boxes. These show the possible data status and
the colour that the data will be shown in if it has that particular status. The status
colours can be changed by clicking on the coloured box and then selecting the colour
for the status from the colour selection window. Any data that has the status will then
show up in the grid in the appropriate colour.
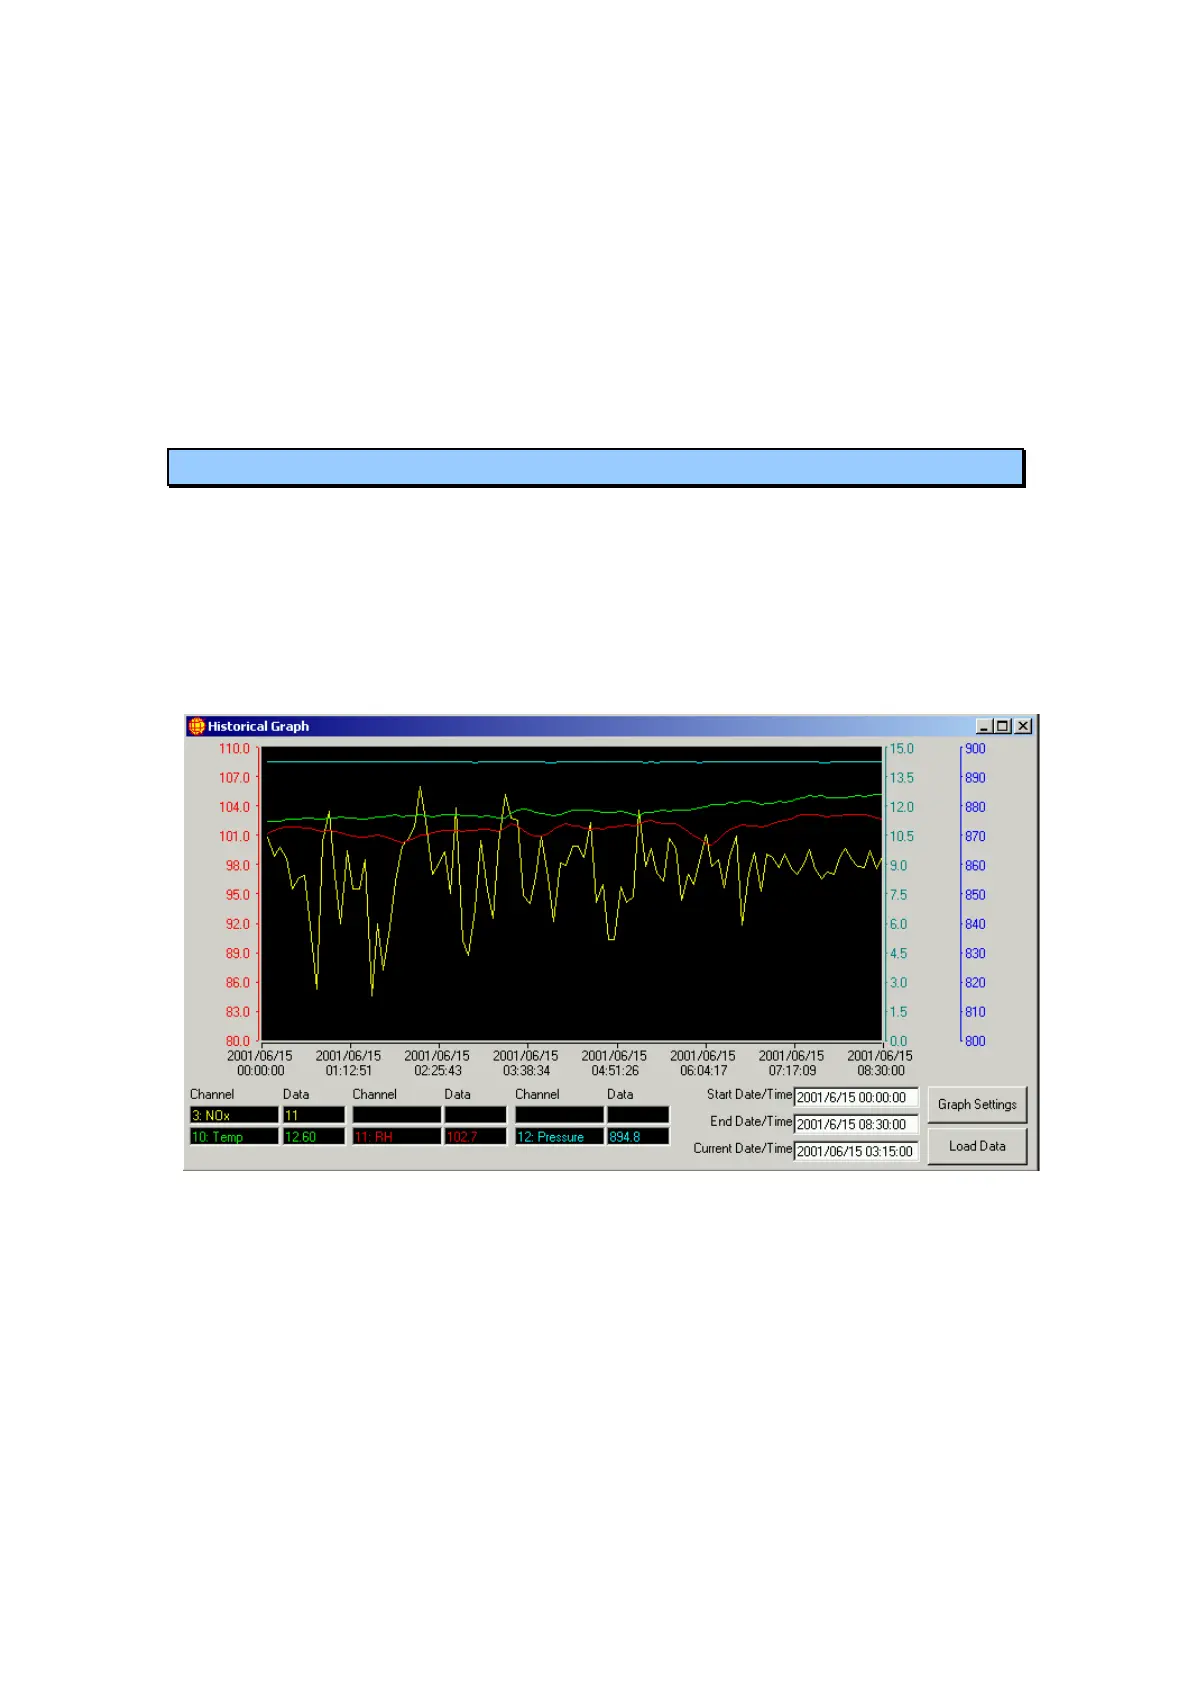
5.4 Historical Graph
The Historical Graph is used to display report data from the database as a graph. It
allows up to six plots of channel data to be drawn, with options for each plot as for the
Instantaneous Graph. The Historical Graph window shows the graph, channel
number and channel value boxes, and a Start and End Date/Time boxes. When the
Load Data button is pressed all data with a time stamp equal to or greater than the
Start Date/Time box and less than or equal to the End Date/Time box will be loaded
from the database.
Figure 52 Historical Graph
To view the graph data at a particular point, click on the graph and a vertical black or
white line will appear on the Graph. The data boxes at the bottom of the window will
display the data value for each plot from that time. The Current Date/Time box shows
the date and time of the data point under the black/white line. The left and right arrow
keys move the line to an earlier or later data point.
Historical Graph Settings
Access this through the Graph Settings button on the Historical Graph window. Each
of the six plots of channel data can be configured individually to suit the needs of the
channel it is plotting.