WinAQMS Mini DAS User manual 1.0 Edit Menu
49
Display Scheme, which will load the settings of a particular scheme.
Report, which shows which report will be displayed on the graph.
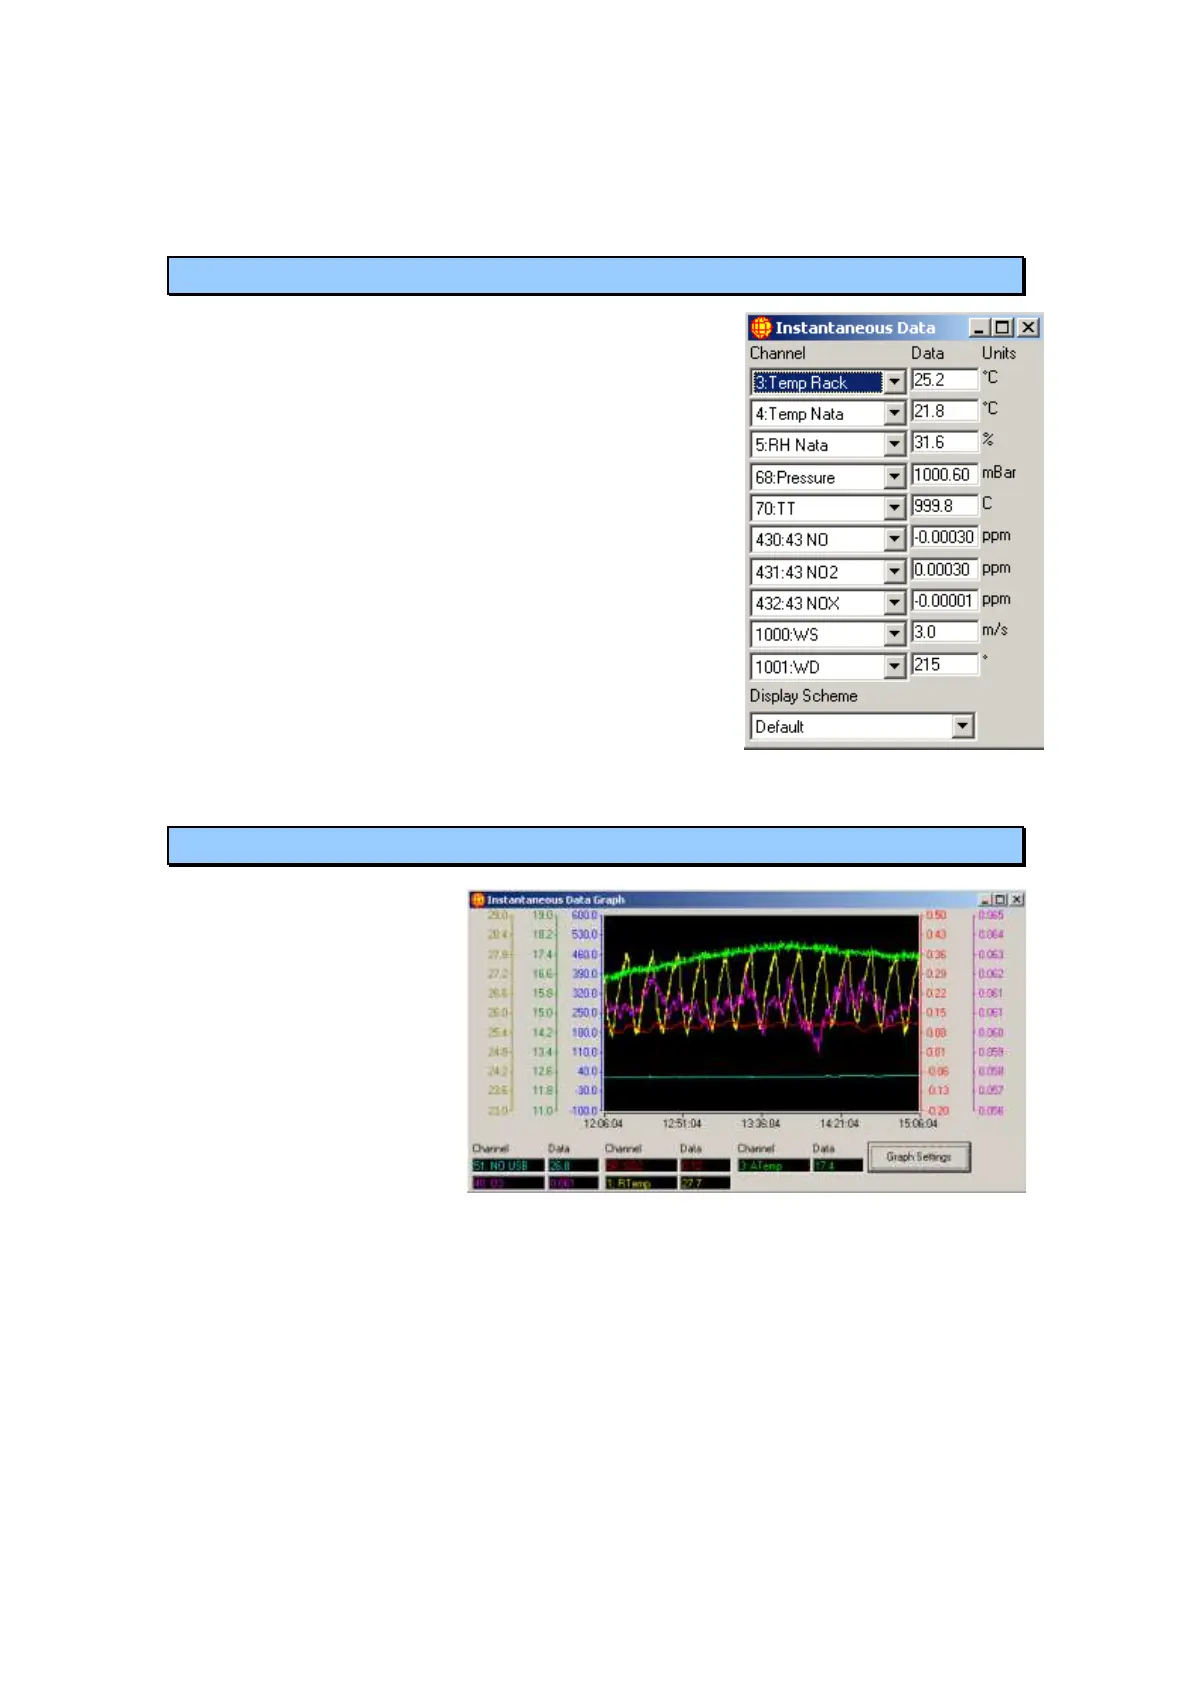
5.5 Instantaneous Data
The Instantaneous Data window shows up to ten
channels with their most recent data and the units of
the channel. Clicking on a dropdown box allows you
change the channel for which the data is displayed.
The window is updated at the speed of the fastest
channel in the system. If the Instantaneous Data menu
option or button is selected when there is already an
Instantaneous Data window visible then a second
window will be displayed. Each of the Data boxes is
shown in a colour indicating its status. An extra field
at the bottom is Display Scheme, which will load the
settings of a particular scheme.
5.6 Instantaneous Graph
The Instantaneous Graph
gives a visual plot of data
as WinAQMS Mini DAS
receives it. The graph can
show up to six plots
simultaneously, each
using different axes, plot
colours and axis colours.
For each channel plotted,
the vertical scale can be
shown as an axis in any
colour. The axes can be
set to have a fixed range
or to auto-scale to match the data that is being plotted. Each plot can be enabled or
disabled and can be shown in a unique colour. To change the settings for the
Instantaneous Graph select the Graph Settings button, which will load the Graph
Settings window.
Graph data from a particular time can be viewed in the same way as for the Historical
Graph, (with the black/white line). As time passes, the line and plots will move
towards the left edge of the screen as new data values arrive. When the line goes off
the left edge of the screen the data values displayed at the bottom of the screen will
return to being the most recently logged values.
Figure 55 Instantaneous Data
Figure 56 Instantaneous Graph