Edit Menu WinAQMS Mini DAS User manual 1.0
48
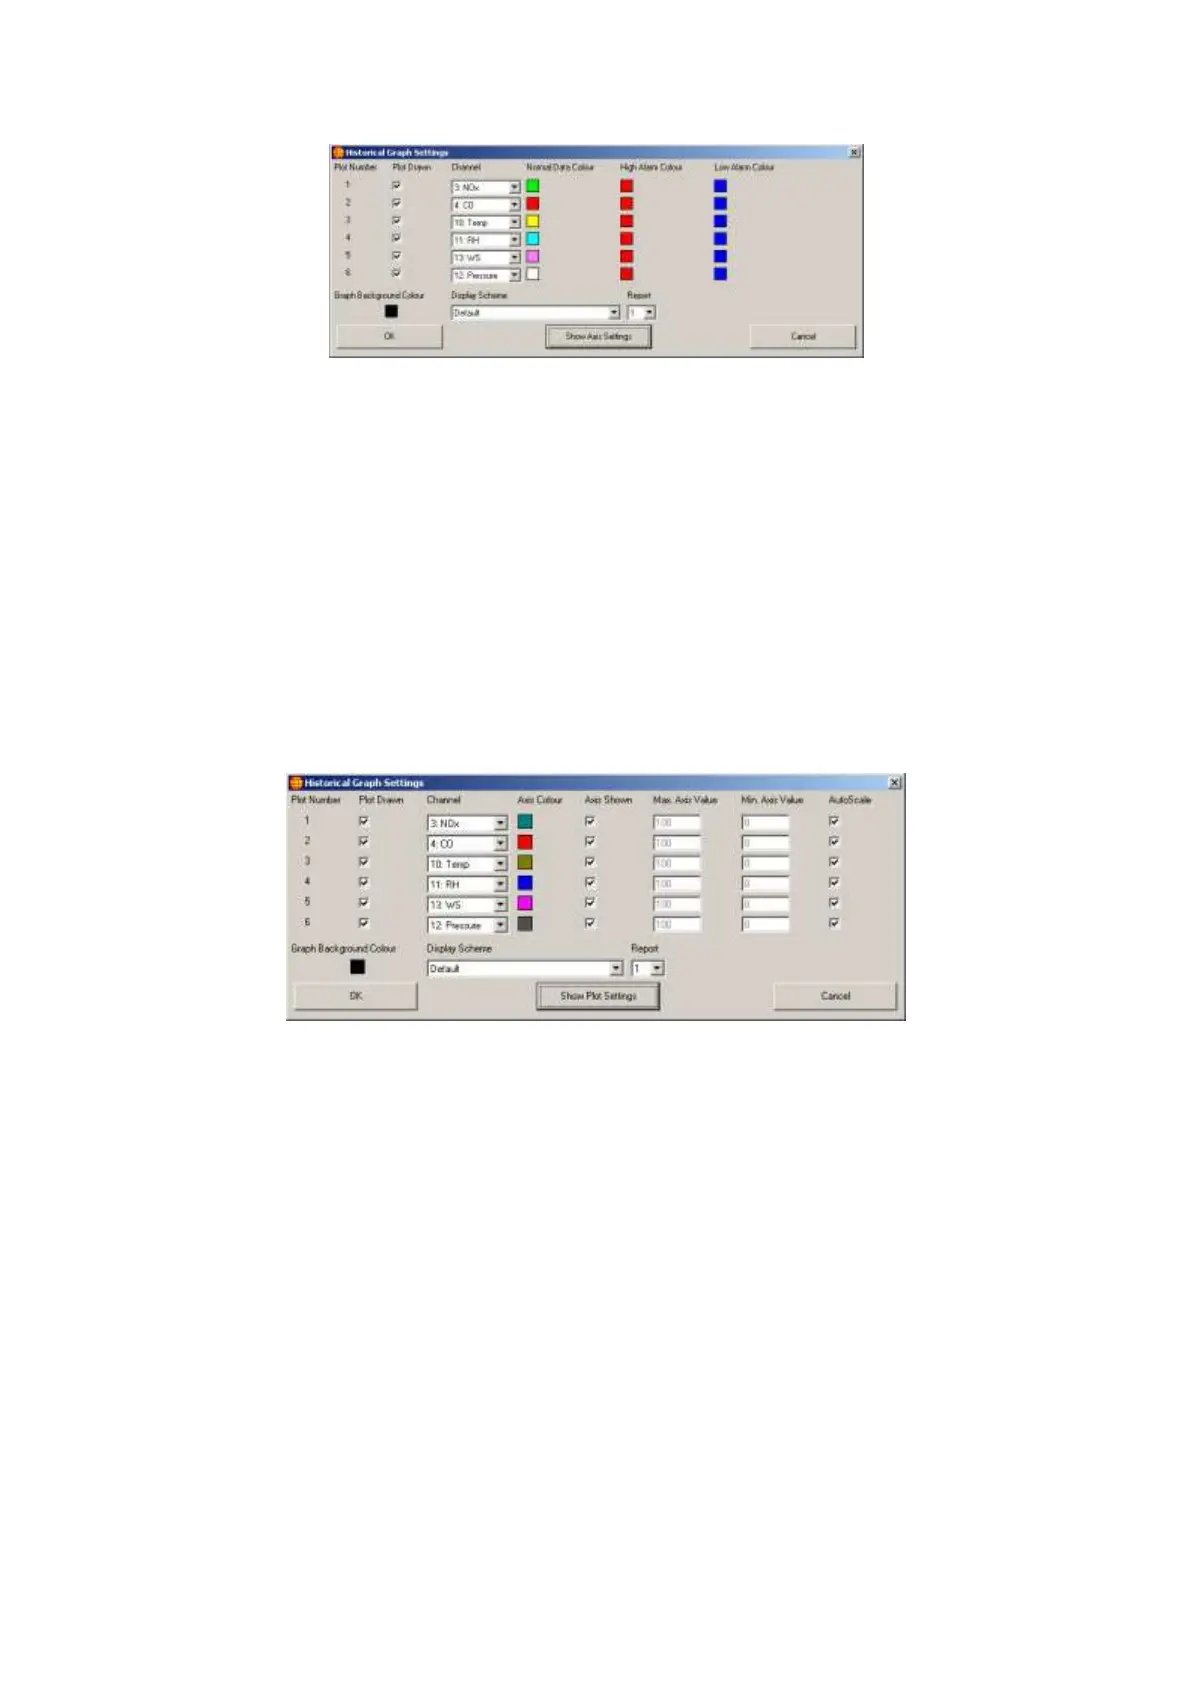
Figure 53 Historical Graph Settings with Plot Settings
The Plot Drawn option will set whether a plot is drawn. If this option is not
selected the data will still be present but the plot will not be drawn.
Channel determines which channel the graph will be plotting.
Normal Data Colour is the colour that the plot will use when the data for the
channel is equal to or below the high alarm value and equal to or above the
low alarm value. To change the Normal Data Colour click on the box with
the plot colour and a colour selection window will appear which will give
you the option of selecting one of several predetermined colours or making
your own colour.
The High Alarm Colour and Low Alarm Colour can be changed in the same
way as the Normal Data Colour.
The Show Axis Settings/Show Plot Settings button allows you to toggle between the
settings for the plots and the settings for the axes.
Figure 54 Historical Graph Settings with Axis Settings
Axis Colour is the colour of the axis for the plot.
To remove the axis for a specific channel remove the tick from the Axis
Shown box.
AutoScale will scale the axis based on the data that has been plotted since
the plot was started. Autoscaling will give the axis a maximum value just
above that of the largest value received and a minimum of just below that of
the smallest value received.
If you do not want the plot to use the autoscaled axis then remove the tick in
the AutoScale box, which will then enable the Max. and Min. Axis Value
boxes. Entering values in these two boxes will set the maximum and
minimum values for the axis and scale the plot using those values.
Available in both Plot Settings and Axis Settings modes are:
Graph Background Colour, which sets the colour that will appear as the
background colour for the graph. It can be changed like the other colour
selections.