Analyzer User Manual
Instant Piconet Pane | Page 227 of 264
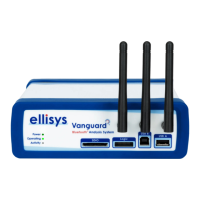
Instant Piconet
pane toolbar:
Instant Piconet
tracks topology while capturing.
When active,
Instant Piconet
cursor in
Instant Timing
is disabled.
Previous data channel topology change.
Next data channel topology change.
Timestamp of current view (link
s to Overview when selected).
Show/hide addresses/device labels.
Show/hide broadcast events.
16.1 Instant Piconet Graphics and Icons
Various graphical elements are provided to give the user an understanding of events, including which devices
are the master (always blue-bordered) or a slave, RSSI indications (green histogram), connection types such
as paging and inquiry events, piconet indicators, and data transfers.
Here is a quick summary of the various representations you can find in the
Instant Piconet
:
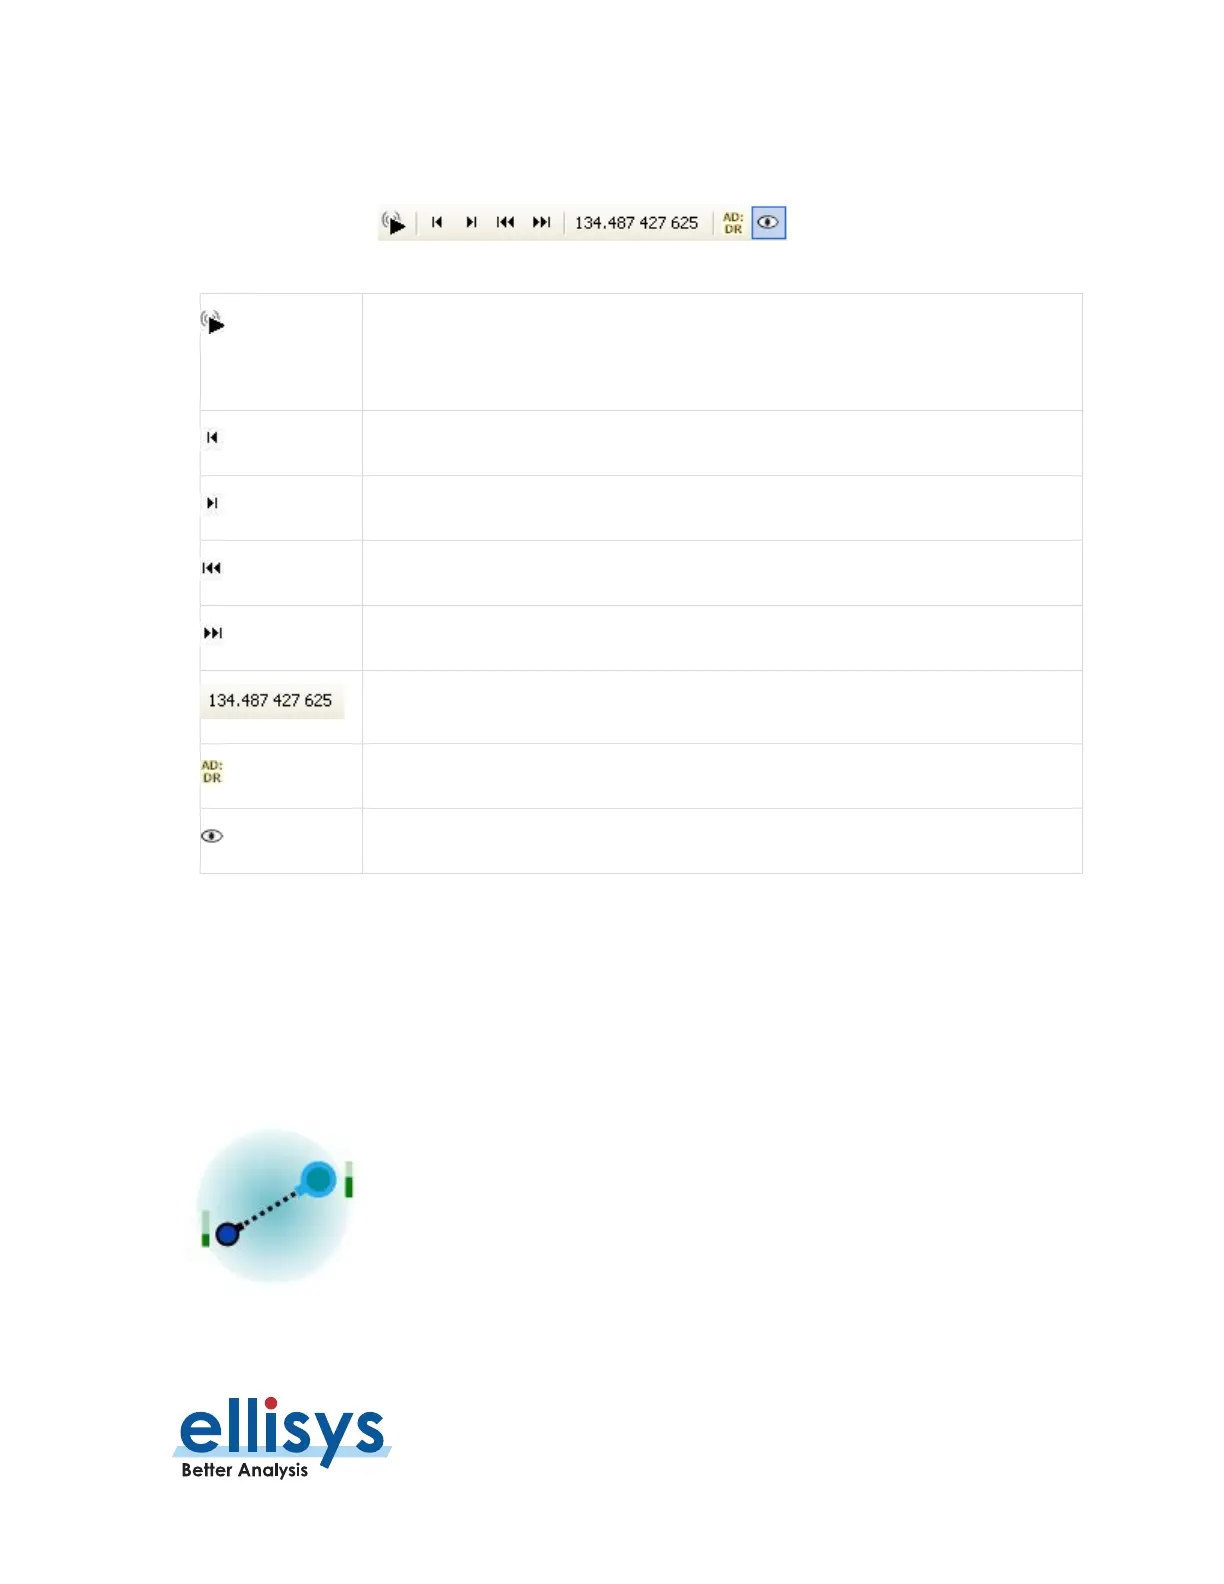
epresents an idle connection between a master and a slave
. Master
devices always have a blue outline. Slave devices always have black outline.
The gauge on the side represents the RSSI of the device.
 Loading...