Analyzer User Manual
User Interface Reference | Page 35 of 264
4. User Interface Reference
The user interface of the Analyzer application provides various windows, panes, menus, toolbars, and other
visual and control elements. All panes are dockable and can be hidden, resized, and re-positioned to suit the
needs and preferences of the user. Most panes are inter-linked to provide synchronization with other panes and
include various display options.
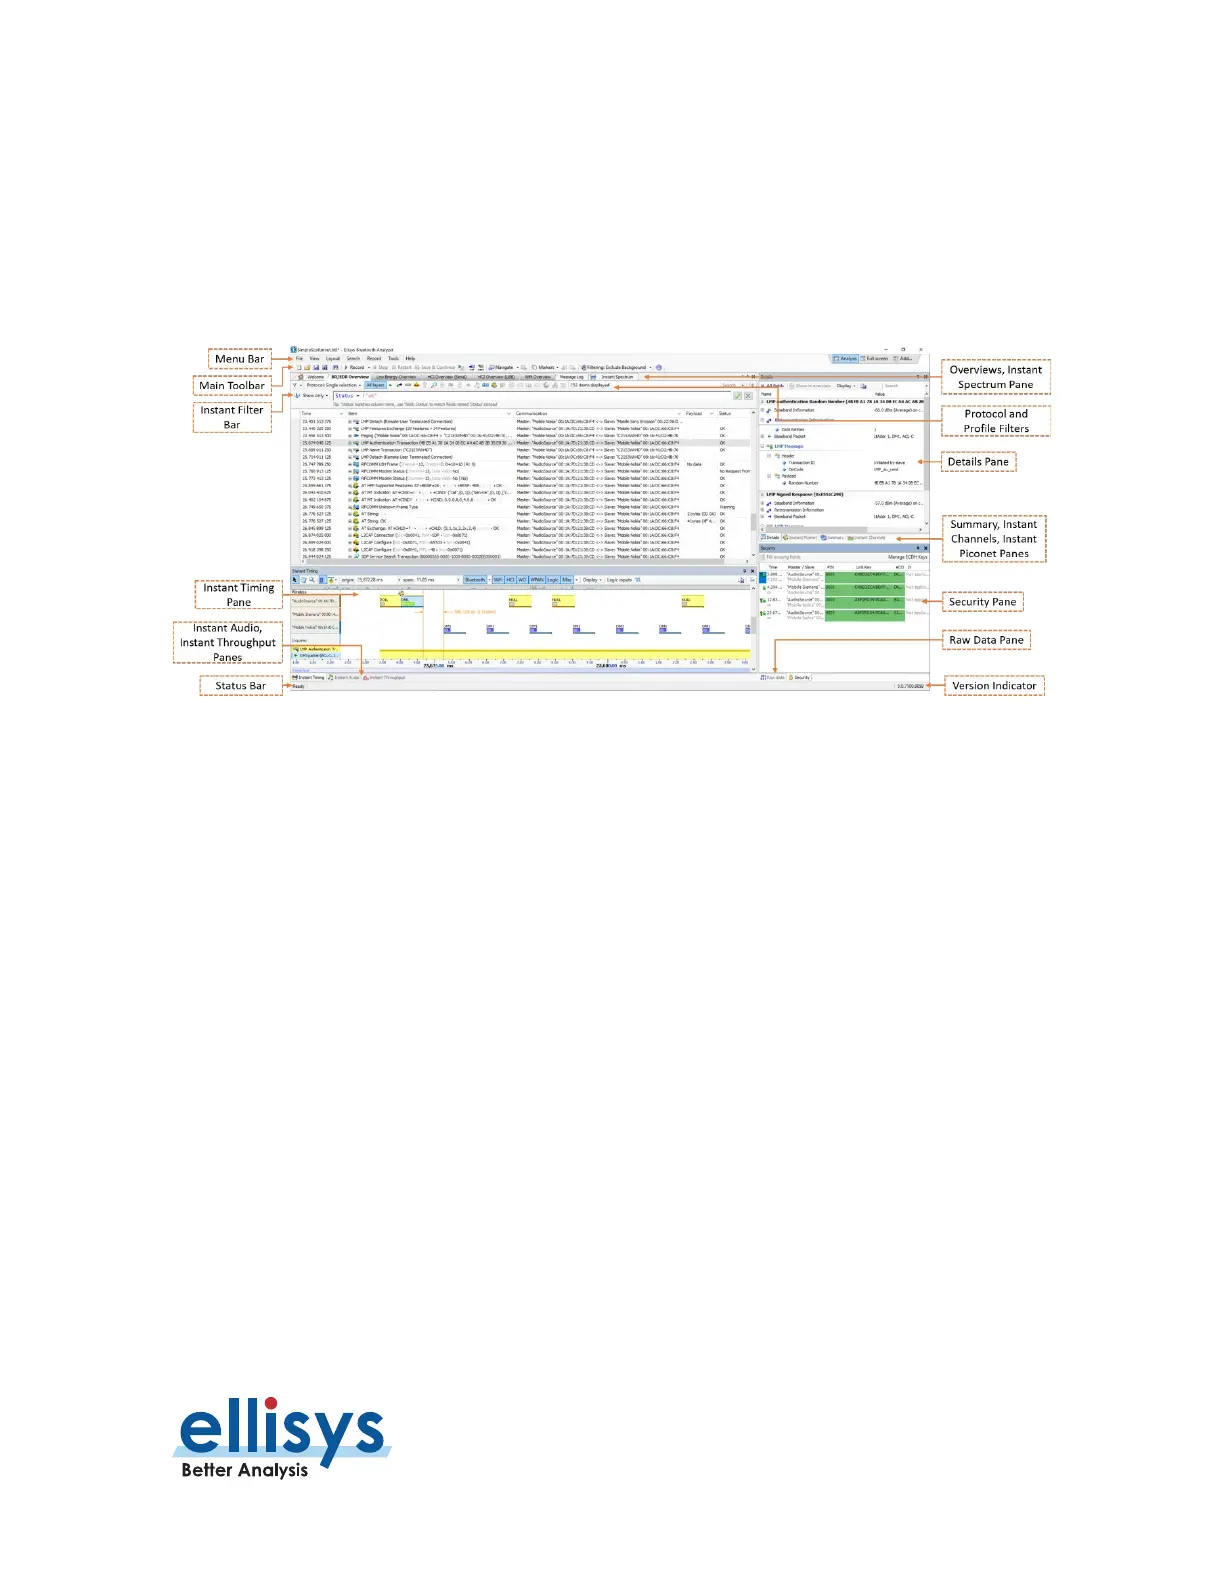
The Analyzer application displays several windows and panes in the default layout. Each pane displays specific
information or allows the user to interact with the software for a given task:
Overviews
– Displays chronological and highly configurable records of traffic and events recorded for
all supported wired and wireless traffic, including BR/EDR, BLE, HCI (UART, SPI, USB), WCI-2, WPAN,
Generic Communications (I2C, UART, SPI, SWD) and a Message Log.
Details Pane
– Displays a detailed breakdown of the event selected in the active Overview.
Raw Data Pane
– Displays the raw data of the event selected in the active Overview. Fields selected
in the Details Pane are yellow highlighted here.
Instant Timing Pane
– Displays a graphical representation of Bluetooth and Wi-Fi packets, HCI, generic
communications, and logic signals captured, and allows for various timing analyses, throughput
indications, and statistical information.
Instant Spectrum
– Displays spectral RF energy characteristics from any sources in the 2.4GHz ISM
spectrum used by Bluetooth (2400-2480 MHz), concurrent with precision overlay of Bluetooth, Wi-Fi,
and WPAN packets, as well as statistical information on Bluetooth transmission characteristics.
Instant Audio Pane
– Displays captured over-the-air and HCI audio streams and provides a variety of
controls including real-time audio play, playback, looping, and other features.
 Loading...