FB107 LCD User Manual
Issued Sep-07 Using the Touchpad 3-29
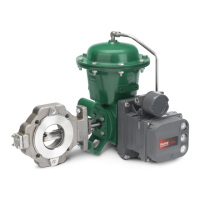
Figure 3-57. Dynamic Chart
Each chart can display up to 54 most recent data values. The
Touchpad alternates the chart header (here, FLOWHR) with the EU
value (MCF), if units are available. The asterisk on the screen
indicates that you can set the upper and lower scale values for the
display.
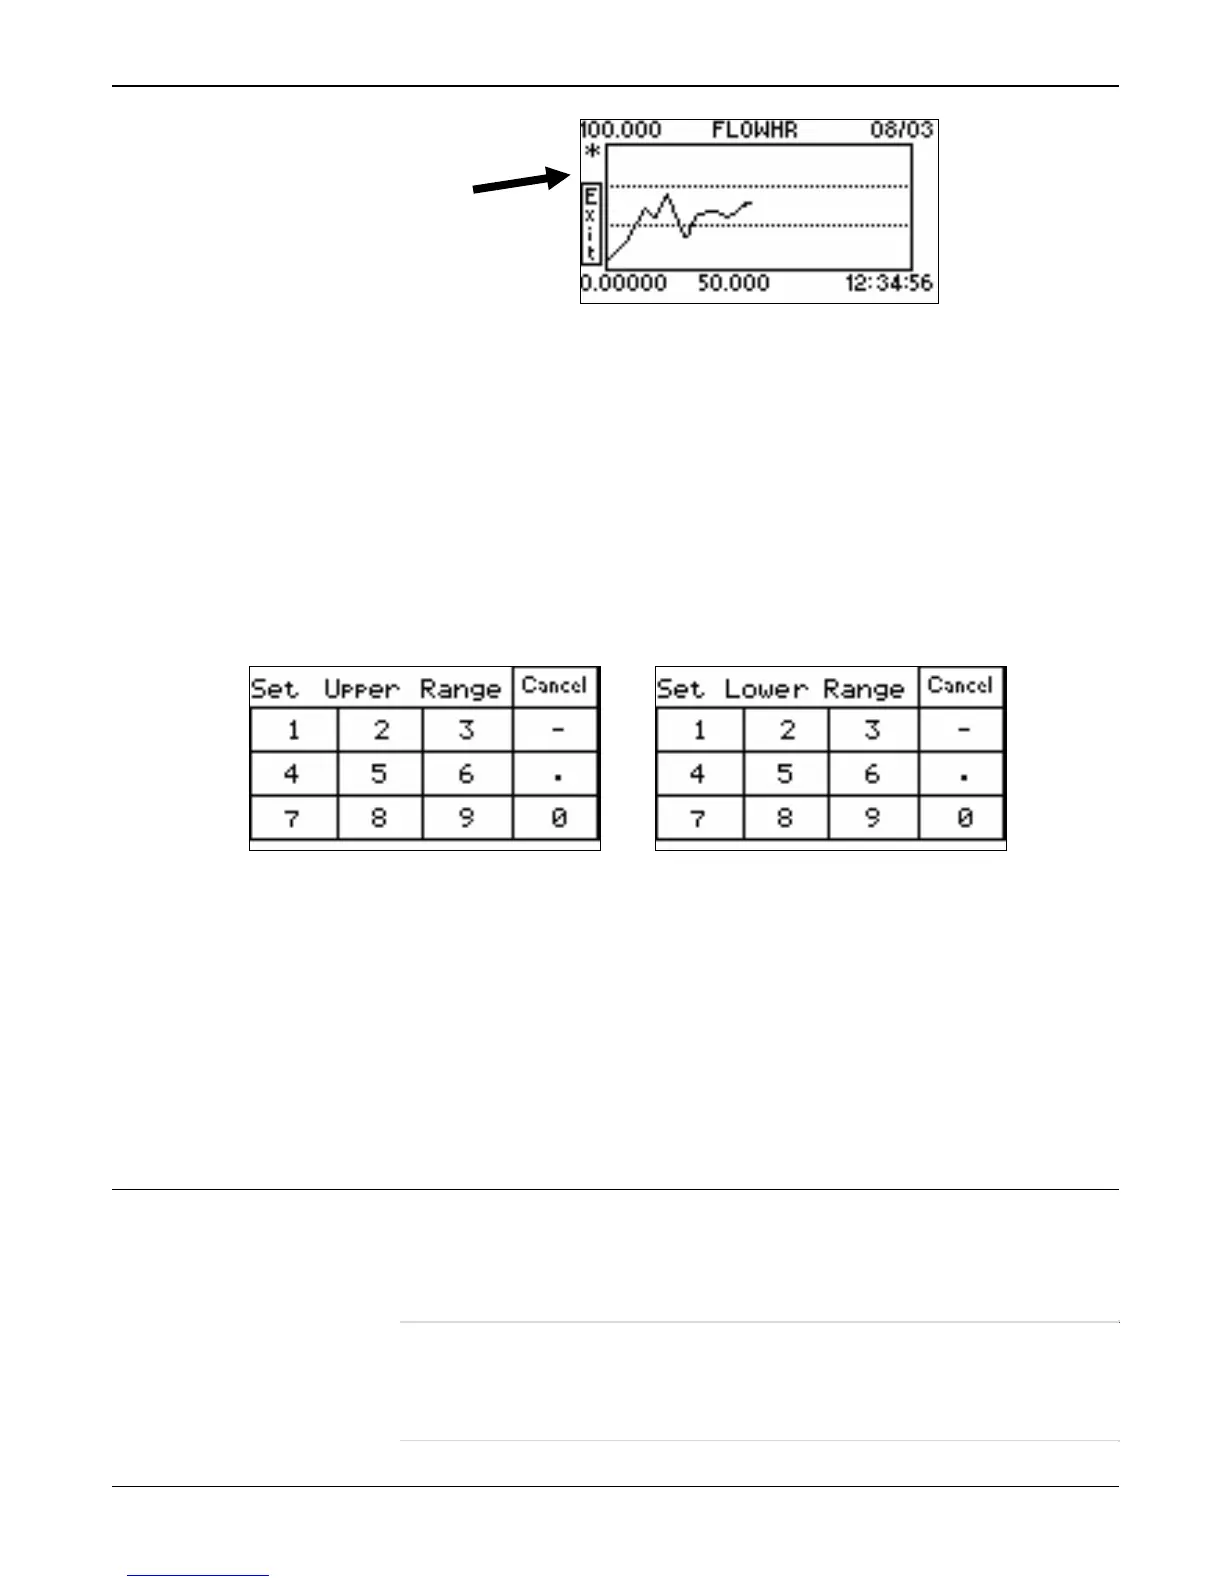
3. Touch the asterisk to set new upper and lower scale values. The
Touchpad displays two screens, in sequence.
Figure 3-58. Upper and Lower Scale Ranges
4. Use each screen to enter a new upper and new lower range for the
display, if necessary. The Dynamic Chart displays.
5. Touch Exit to display the Dynamic Data menu.
6. Touch Exit to display the Chart menu.
7. Touch Exit to display the Modules menu.
3.7 PID Loops
This option provides two methods—basic and advanced—for displaying
and changing Proportional, Integral, and Derivative (PID) loops. You can
define up to eight PID loops on an FB107.
Note: Use the Points tab on the ROCLINK 800 Device Information
screen (ROC > Information) to define the total number of active
PID loops; use the PID Loop screen (Configure > Control > PID
Loop) to initially define the PID loops.

 Loading...