FB107 LCD User Manual
Issued Sep-07 Using the Touchpad 3-33
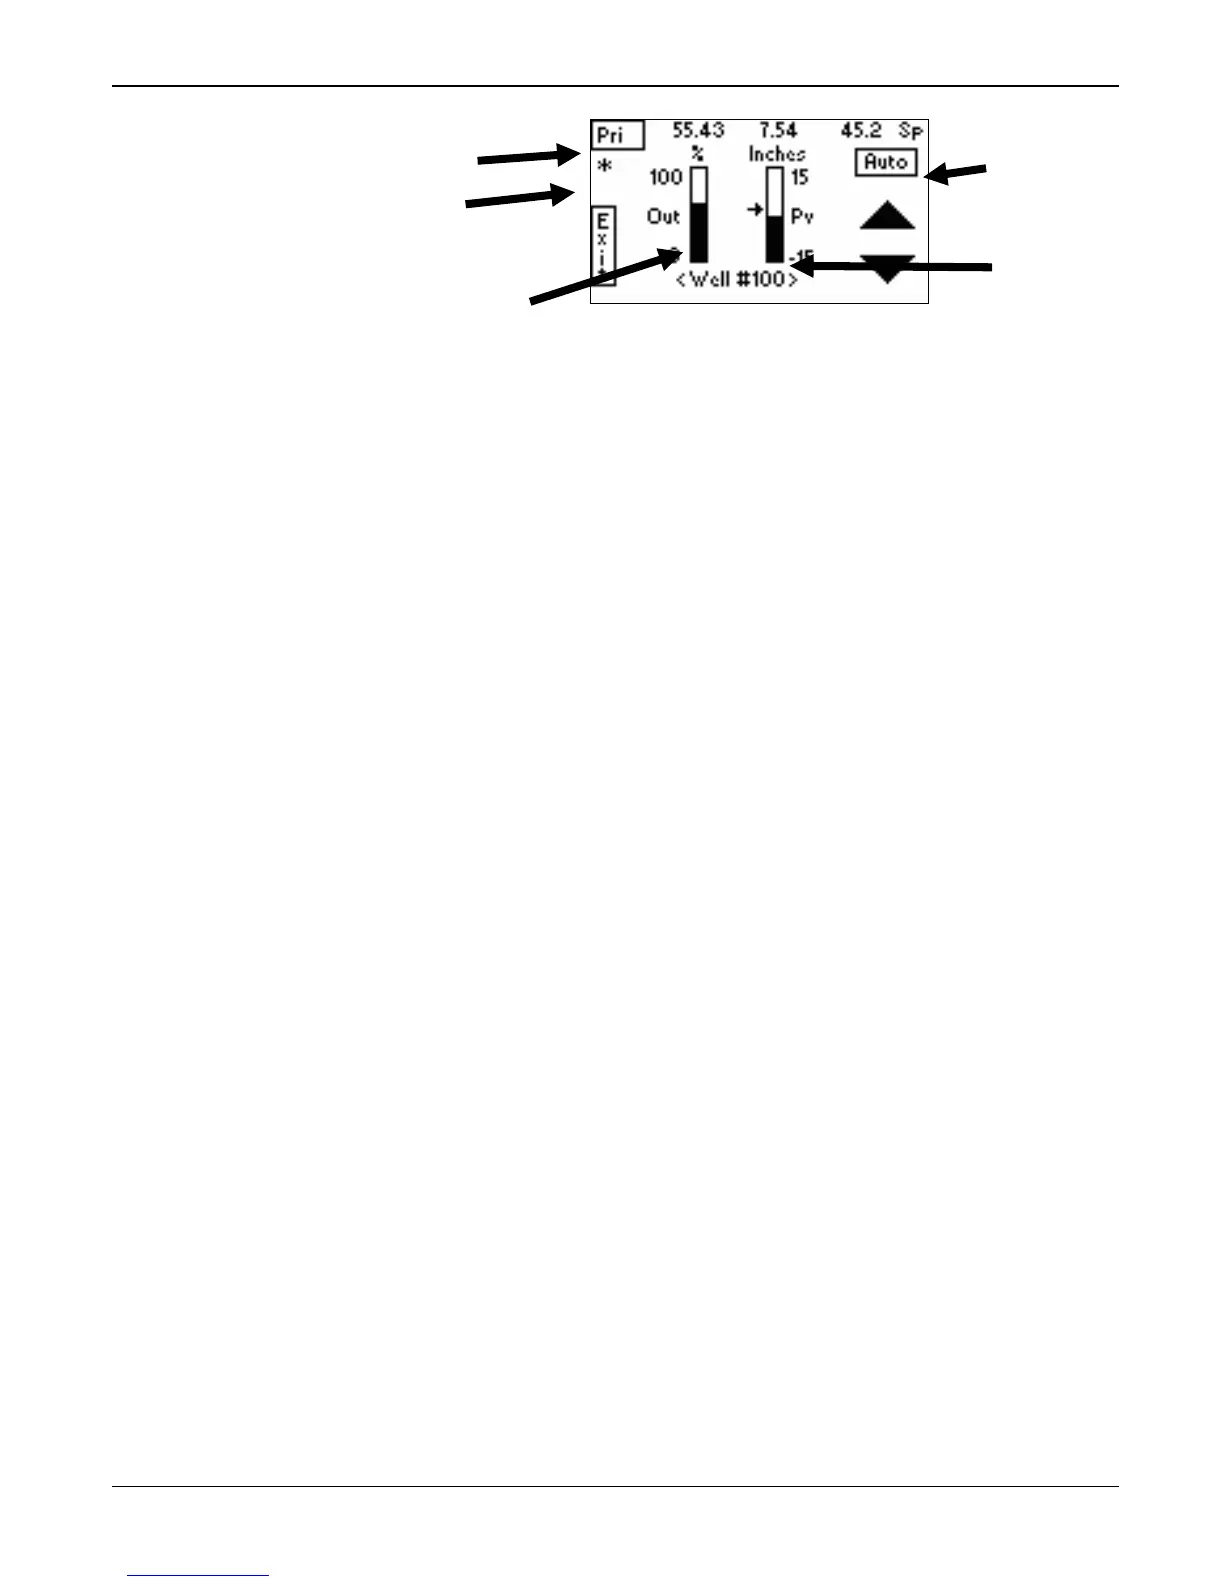
Figure 3-67. Graphical PID Loop
This display provides a “dashboard” view of the selected PID loop.
The left vertical bar graph represents the output value for the PID
loop; the right bar graph represents the process variable value for the
loop. Units for each bar graph display at the top of each graph. The
upper and lower EU values for each bar graph display at the top and
bottom of the graph. This is a dynamic display: as the output or PV
values change, the graphic changes.
Touch the Output or PV vertical bar graph to access charts that
display these values.
Touch S or T to modify the output or setpoint, depending on the
PID loop’s current mode (Auto or Manual, indicated by the boxed
value in the upper right corner of the display). If the PID mode is
Manual, the buttons change the output parameter. If the PID mode is
Automatic, the buttons change the PID setpoint. Touch and release a
button to change the value by one percent; touch and hold the button
down to more quickly change the value.
To change the PID mode (from Auto to Manual or Manual to Auto),
touch and hold down the Auto/Man value for two seconds. The green
Key Acknowledgement light blinks, indicating that the value has
changed. This two-second touch prevents you from accidentally
changing the PID mode. The indicator arrow on the bar graph also
moves, indicating which value you can now change.
The upper right corner of the display indicates whether the Touchpad
is displaying information from the PID loop’s Primary or Override
control loop. Touch this field to switch between the loops. (This is an
option only if you have selected Override Control as the Control Type
on the General tab on the PID Loop screen in ROCLINK 800.) An
asterisk (*) in the upper left corner of the graphic indicates whether
the selected loop is in control.
3. Touch Exit to display the PID Loop menu.
4. Touch Exit to display the PID menu.
Loop selector
Loop control
indicator
PID
Mode
indicator
Output bar graph
PV bar
graph

 Loading...