Page 74 of 159
8 Result Interpretation
This chapter provides description about interpreting and understanding reports provided by
the ‘ELite 5’ analyzer.
8.1 The Result Screen
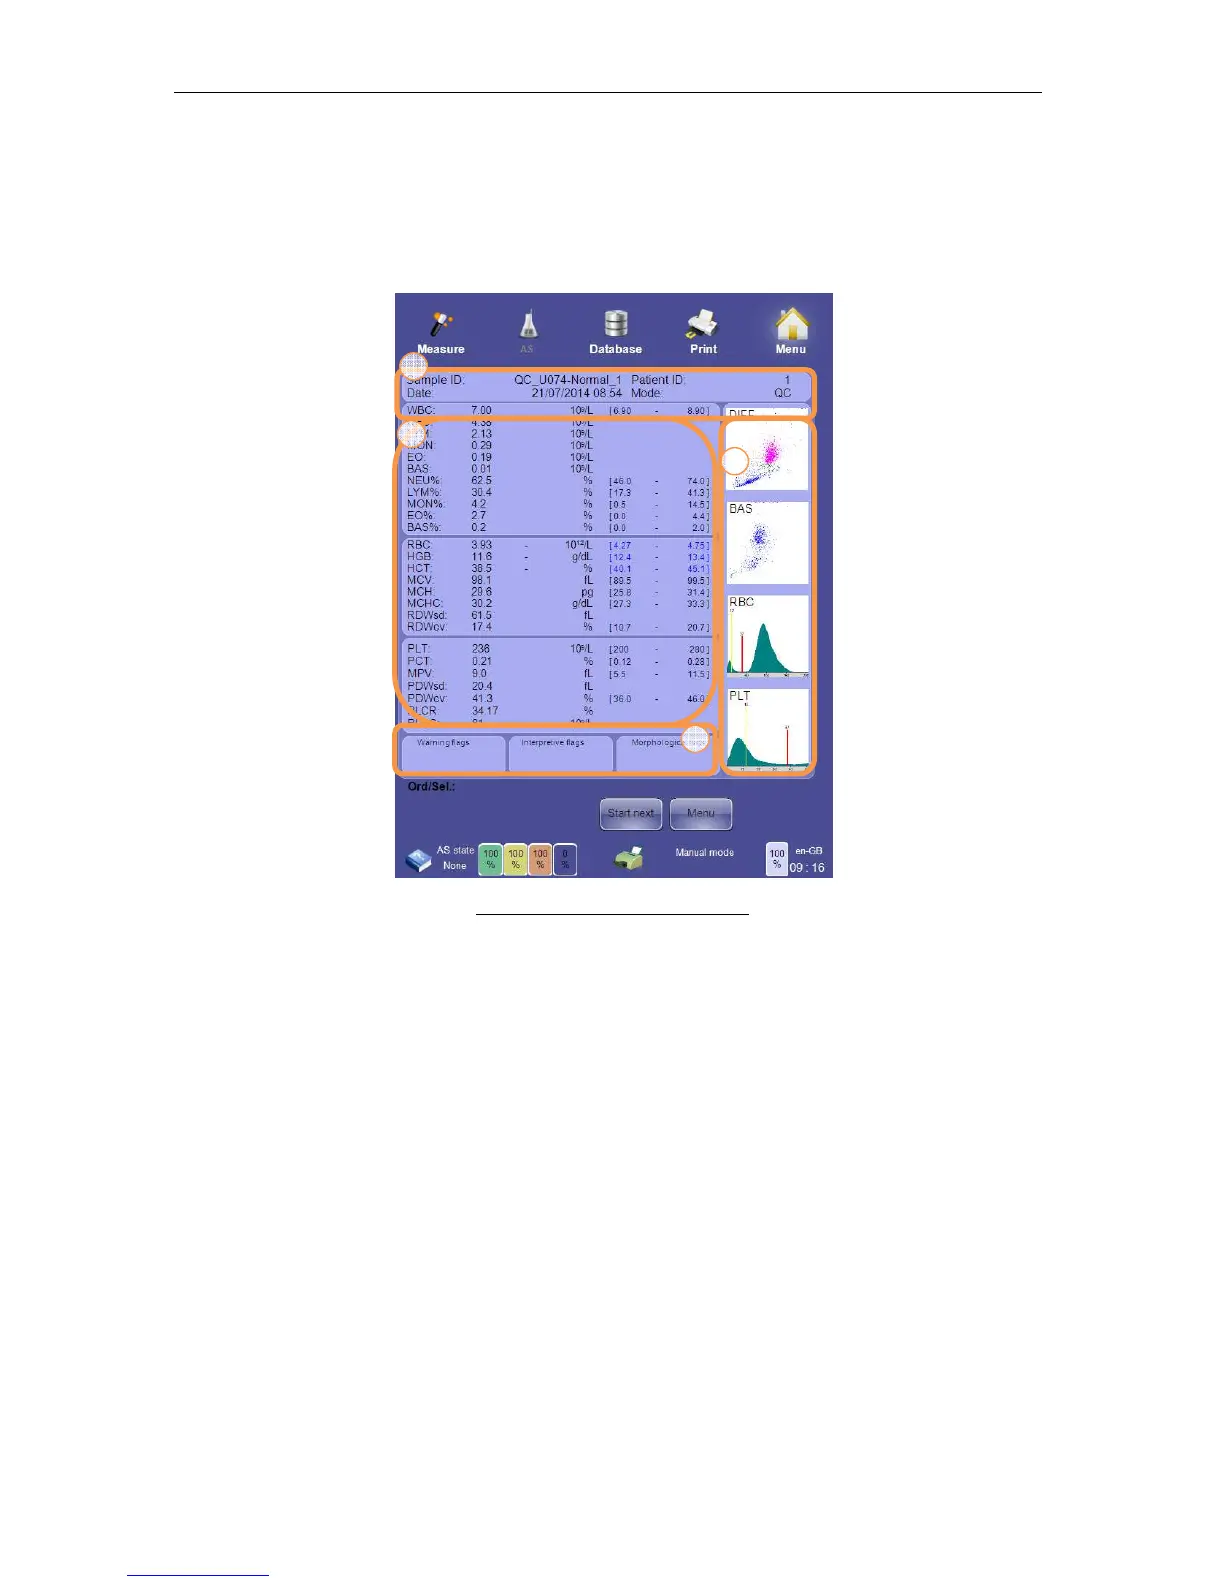
Figure 53. ‘ELite 5’ Result Screen
The ‘ELite 5’ analyzer result screen is divided into 4 major areas:
1. Sample identification information: contains identifying information used to uniquely
identify this sample’s information.
2. Parameter information: contains parameter names, values, units, and normal range.
Normal range, linearity, and high blank flags are also displayed in this area.
3. Histograms and scatter diagrams: visual elements that provide information about the
measured population dispersion. These are active elements that can be individually
magnified by clicking or tapping.
4. Warning flags area: this area displays warning, interpretive, and morphological flags
associated with this sample. If flag display overflows its assigned space, an ellipsis
will be displayed and the user can click on the information icon to see a detailed
display of flags.
8.2 Sample Identification Information
This part of the results screen contains information that uniquely identifies a particular
sample run.