Page 77 of 159
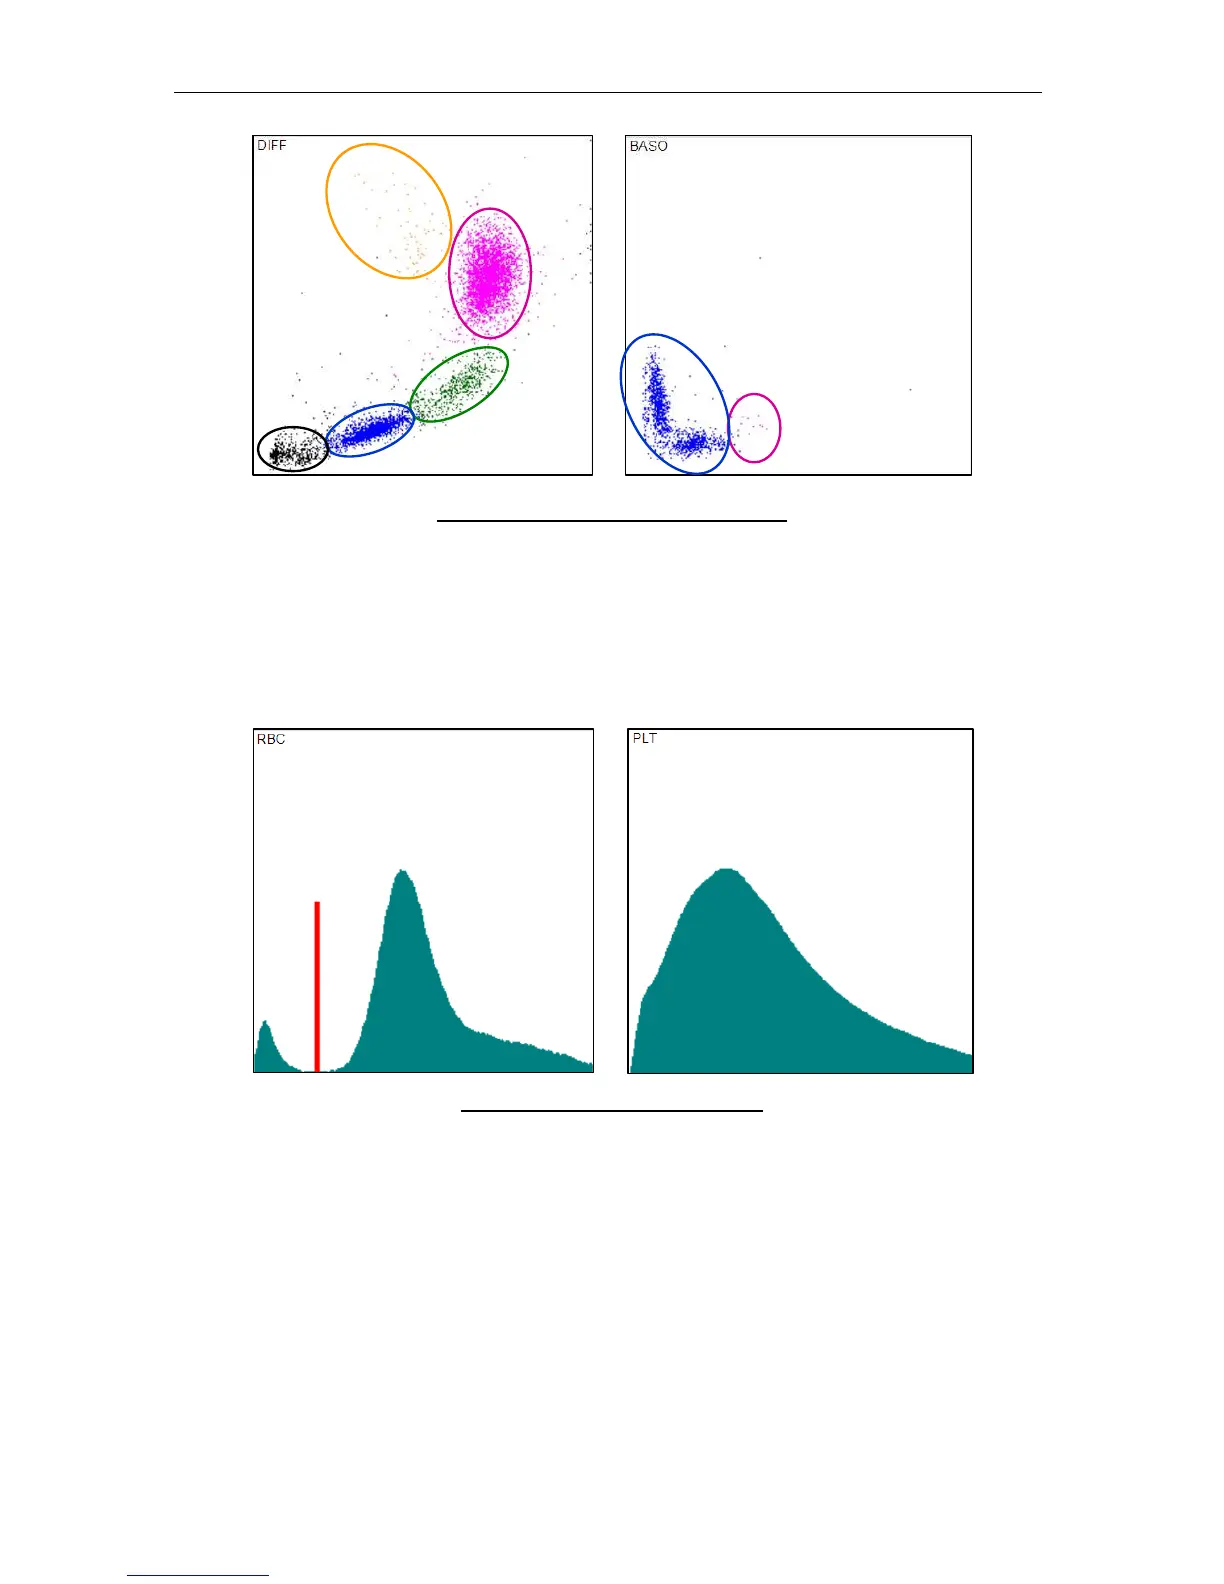
Figure 56. Result Screen Scatter Diagrams
RBC and PLT impedance-based measurements are represented by histograms. These
diagrams show the number of cells on the Y axis and the cell size on the X axis. Smaller
cells are displayed on the left side of the histogram, and larger cells are displayed on the
right side. The height of the histogram at a given size represents the number of cells with that
size. Greater histogram height indicates more cells.
Figure 57. Result Screen Histograms
Both the RBC and PLT histograms can be zoomed. Discriminators (thresholds) are displayed
with red color. Platelets are located on the leftmost part of the RBC histogram to the left of
the red discriminator. The PLT histogram is a magnified version of this region.
8.3.2 Warnings
The warnings area of the result screen shows flags and messages related to the evaluation
of the sample. Clicking or tapping the question mark icon on the left side of the warnings
section of the results screen displays a detailed warnings panel. Click or tap OK to close the
detailed warnings panel.
Eosinophils