Linearity range flags are raised when a particular parameter is above or
below the linearity range of the device.
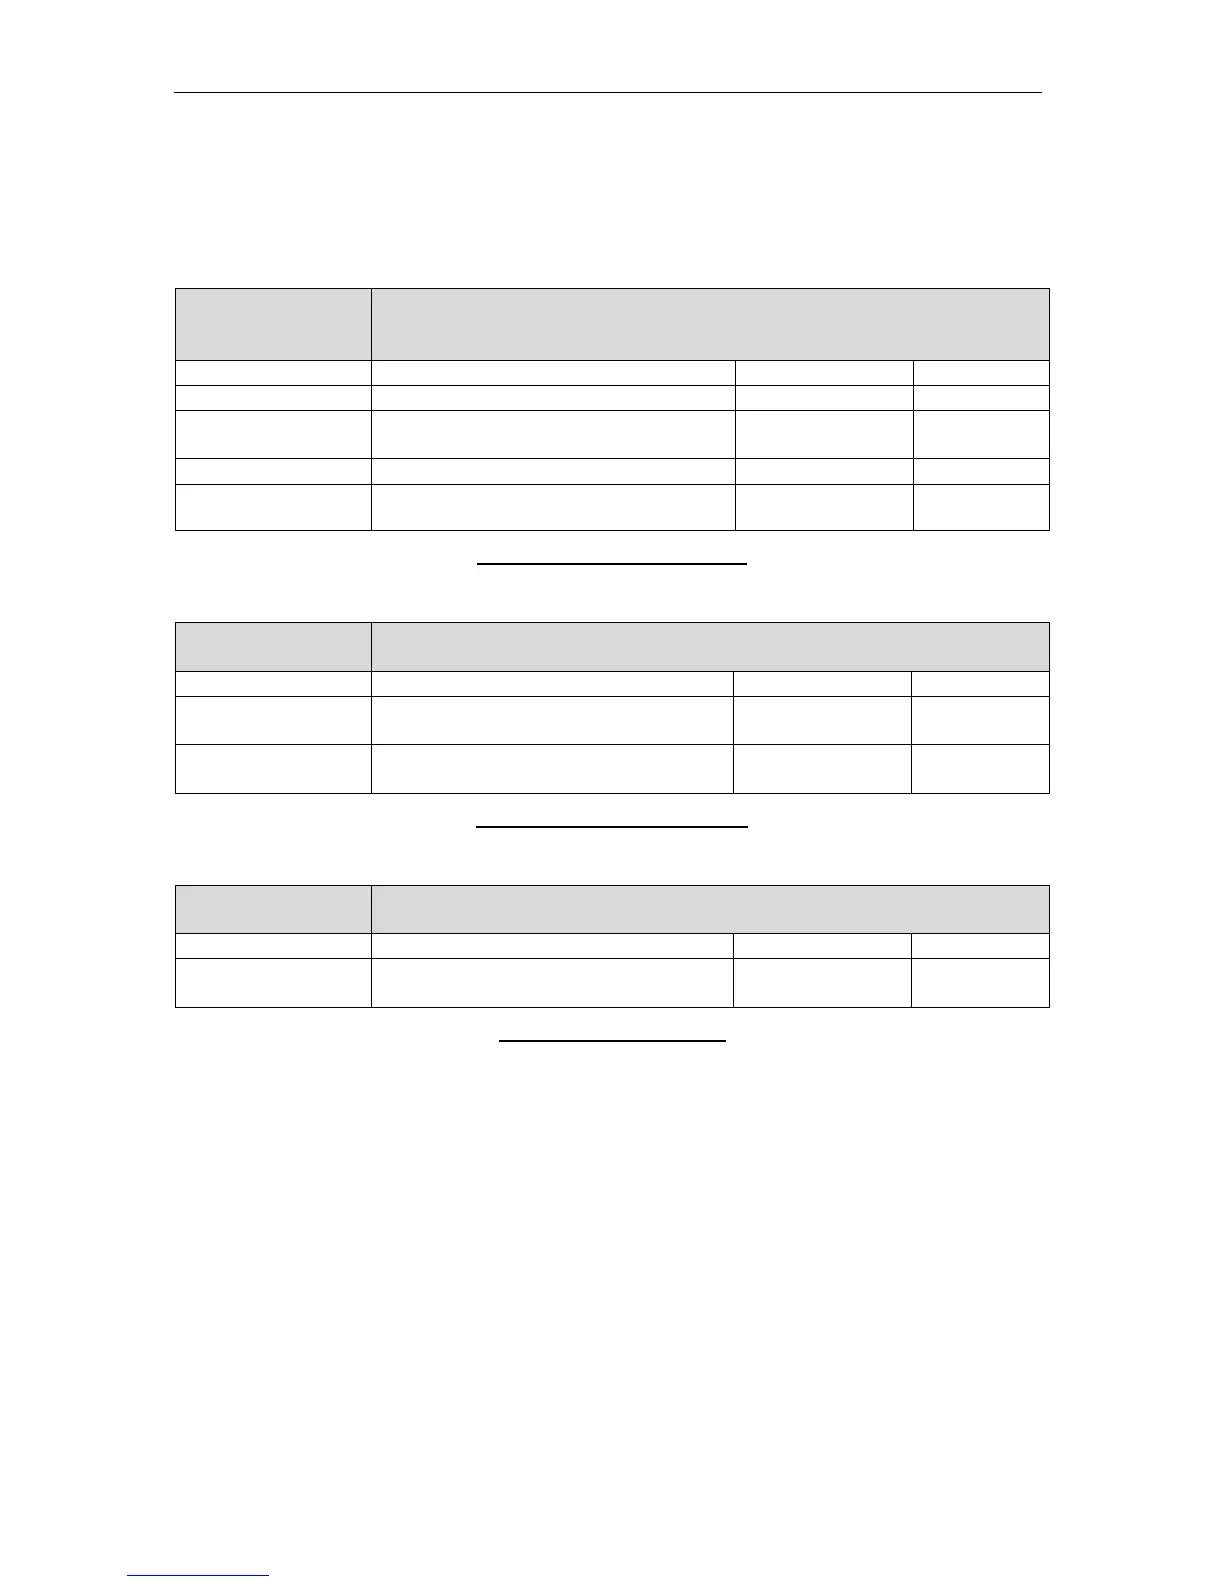
Flag Meaning Hierarchy Color Code
*
The related parameter is out of the
linearity range
High N/A
**
The related parameter is out of the
display range.
High N/A
Table 6. Linearity Range Flag
High blank flag
A high blank flag is raised when the blank measurement result of the
particular parameter was higher than the blank limit.
Flag Meaning Hierarchy Color Code
!
The blank value of the related
primary parameter is high
Middle N/A
Table 7. High Blank Flag
8.3.1 Scatter Diagrams and Histograms
The ‘ELite 5’ analyzer displays the results of the optical measurements in scatter diagram
representation. Scatter diagrams represent two-dimensional data. There are two scatter
diagrams in the patient report: the 4-DIFF and BASO scatter diagrams.
The 4-DIFF scatter diagram displays cells identified after the first lysing and optical
measurement process. Due to the measurement technology, cells are classified based on
their optically detected properties: low and high angle scattered light intensity. The optical
detector can measure the intensity of the light scattered or diffracted by each cell. One
portion of this scattered light is proportional to size of the cell the other is proportional to the
complexity of the internal structures in the cell.
Cells in a leukocyte sub-population have similar light scattering properties, allowing them to
be grouped together and identified separately from other cell types. Different colors are used
to identify various populations of blood cells.