Evaluation
35
MMS
®
Inspection DPM High
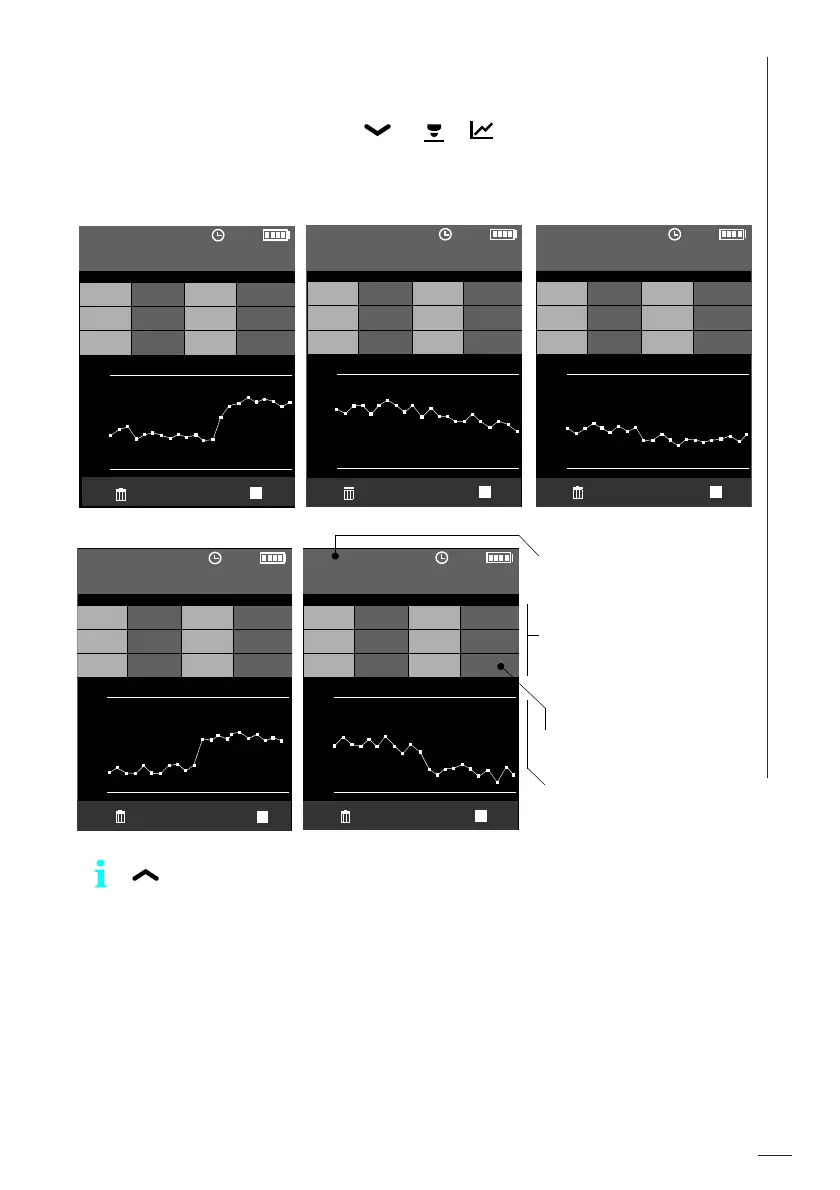
7.2 Run charts of climatic variables
► Call up run chart with the stored values for each climatic variable of the
opened batch: Main menu ( ) > > (from Measurement view)
Examples for run charts; for a description of the characteristic variables,
see page 92.
54:41
Batch 003
RH 41.4 Ta 24.6
Ts 20.5 Td 10.6
Ts-Td 9.9 n 22
RH
50.0
30.0
%RH
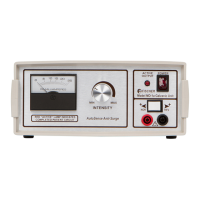
54:40
Batch 003
RH 39.1 Ta 24.1
Ts 21.5 Td 9.4
Ts-Td 12.1 n 22
Ta
28.0
18.0
°C
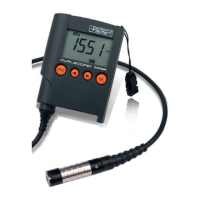
54:39
Batch 003
RH 40.6 Ta 24.0
Ts 19.5 Td 9.8
Ts-Td 9.7 n 22
Ts
25.0
19.0
°C
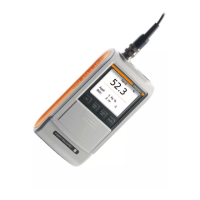
54:37
Batch 003
RH 42.1 Ta 23.9
Ts 19.7 Td 10.3
Ts-Td 9.4 n 22
Ts-Td
17.0
7.0
°C
54:38
Batch 003
RH 42.8 Ta 23.3
Ts 21.0 Td 10
Ts-Td 11.0 n 22
Td
12.0.
7.0
°C
Remaining time up to the
next value storing (54
minutes and 37 seconds)
In this statistic view the
permanently value aqui-
sition are shown in a
table
n = Number of stored val-
ues per climatic variable
Run chart of the stored
values for the selected
climatic variable, the set
specification limits deter-
mine the diagram scale
: scrolls through the run charts of climatic
variables